Upload date
All time
Last hour
Today
This week
This month
This year
Type
All
Video
Channel
Playlist
Movie
Duration
Short (< 4 minutes)
Medium (4-20 minutes)
Long (> 20 minutes)
Sort by
Relevance
Rating
View count
Features
HD
Subtitles/CC
Creative Commons
3D
Live
4K
360°
VR180
HDR
7,040 results
In this video we take a look at the best resources to learn Data Visualization in 2025! 25% off Analyst Builder Code: ...
15,859 views
9 months ago
Try CodeCrafters for free using my referral link: https://app.codecrafters.io/join?via=trentpark8800 This video gives data ...
3,171 views
2 months ago
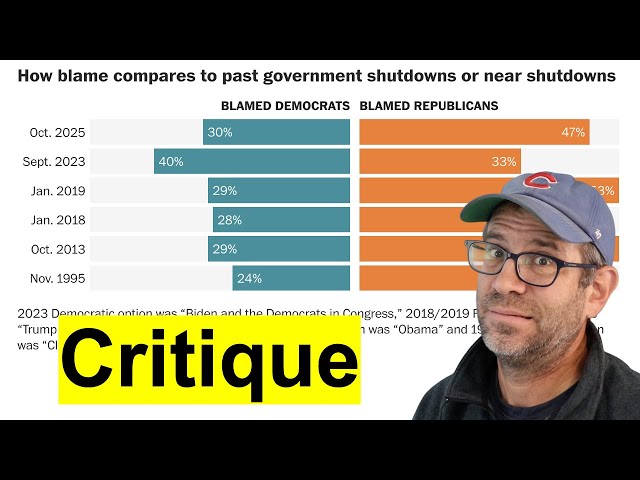
Pat introduces the DAIJ model for giving a critique to a data visualization that is often used to critique art. By describing, analyzing ...
672 views
4 months ago
Join the Skool AI Community – blueprints, tutorials, tools & expert help to level up fast! https://bit.ly/454oVuE Links ...
11,430 views
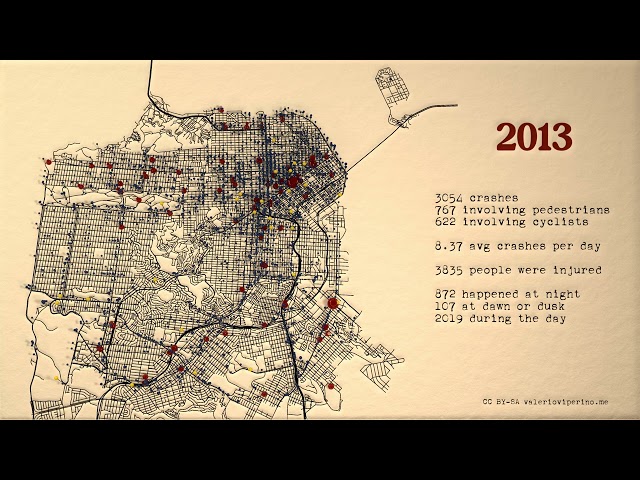
Data visualization in Houdini of 20 years of crashes in SF, using open data provided by https://data.sfgov.org. Main blog post: ...
16 views
1 month ago
This video provides special data visualisation of Herbig-Haro 49/50, as seen by the NASA/ESA/CSA James Webb Space ...
10,626 views
11 months ago
After critiquing this figure and recreating it, now it's time to see if we can't improve it in R.
441 views
Streamed 4 months ago
In this video, Romain Buisson of Mekom Solutions and the Ozone support team shares how the connection between OpenMRS ...
176 views
5 months ago
Fist Rolling sounds like a fast machine gun, but how fast can it be?
12 views
Neon Line Graph Animation | Stock Market & Business Chart Template | Data Visualization Visualize your data with impact using ...
30 views
6 months ago
"SciBlend: Advanced Data Visualization Workflows" by José Marín at Blender Conference 2025 Scientific data visualization is ...
3,179 views
Animated Business Growth Chart Loop | Data Visualization | Upward Trend Bar Graph 4K Looking for professional motion ...
128 views
3 months ago
48 views
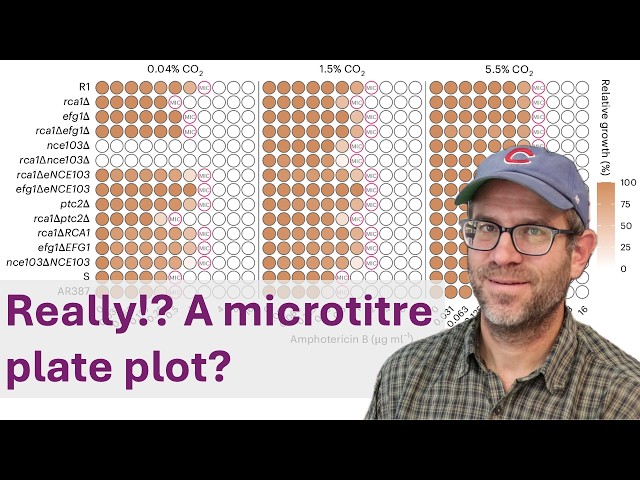
Pat critiques a figure from a paper published in the scientific journal Nature Microbiology that created a unique heatmap that ...
592 views
This high-end digital advertisement captures the explosive energy of an elite athlete in full sprint. The subject, named “Darius ...
6 views
53 views
This is a recording of a talk given by Kate Isaac about best practices for data visualizations, especially for complex data for the ...
5 views
111 views
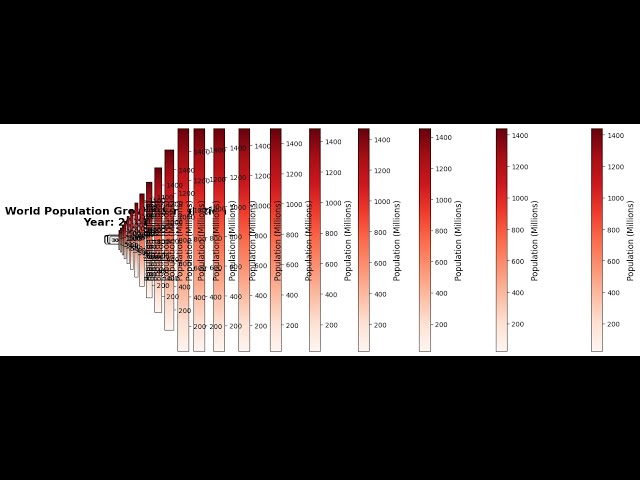
Experience how the world population has grown over the decades in this fast, clean, and engaging data-visualization animation.
20 views
An overview of data visualization techniques in R using the {ggplot2} package.
129 views