Upload date
All time
Last hour
Today
This week
This month
This year
Type
All
Video
Channel
Playlist
Movie
Duration
Short (< 4 minutes)
Medium (4-20 minutes)
Long (> 20 minutes)
Sort by
Relevance
Rating
View count
Features
HD
Subtitles/CC
Creative Commons
3D
Live
4K
360°
VR180
HDR
130,980 results
Check out my Full Tableau Course Here: https://www.analystbuilder.com/courses/tableau-for-data-visualization This is our first of ...
984,513 views
4 years ago
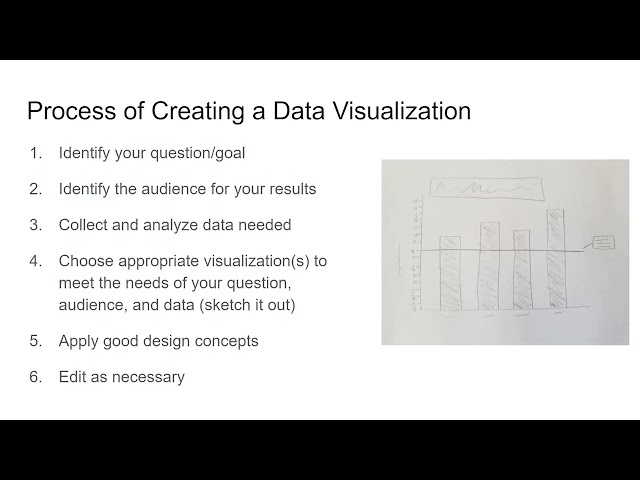
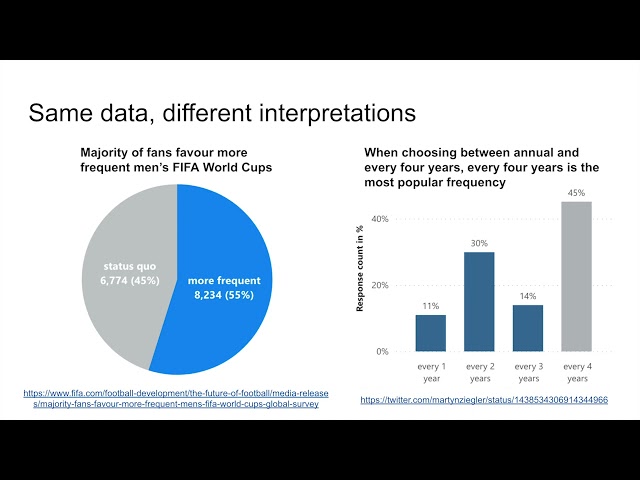
Presented by Alisa Rod. This video is part of a series of lectures recorded to teach about basic data visualization concepts.
321 views
Welcome to our comprehensive tutorial on **Python PANDAS for Beginners**! In this video, we will dive into the powerful world of ...
102,644 views
1 year ago
In this video we take a look at the best resources to learn Data Visualization in 2025! 25% off Analyst Builder Code: ...
15,939 views
9 months ago
In this video, we dive deep into the world of data visualization in Python using three powerful libraries: Matplotlib, Seaborn, and ...
3,558 views
Presented by Tess Grynoch. This video is part of a series of lectures recorded to teach about basic data visualization concepts.
29 views
Hello everyone! In todays video I want to show you how you can use Obsidian for data visualization by using Obsidian Charts, ...
25,776 views
2 years ago
Whenever we see or generate a data visualization it's important that we review what does and doesn't work in the visual. In this ...
1,867 views
... Data Analysis Specialization - https://coursera.pxf.io/AoYOdR Tableau Data Visualization - https://coursera.pxf.io/MXYqaN ...
217,460 views
3 years ago
This segment covers creating a new project, setting up your working directory, and installing/loading the required packages.
6,866 views
Presented by David Christensen. This video is part of a series of lectures recorded to teach about basic data visualization ...
315 views
In this course you will learn how to visualize data with python matplotlib library. #Matplotlib is very powerful python library that can ...
6 views
Using Ellipse and Shape Builder create Data Visualization Graph in Adobe Illustrator Adobe Illustrator Tutorial Graphic Designer ...
2,545 views
7 months ago
... Katrina and Tim dive into the key differences between Sigma and Tableau, two leading data visualization tools. Katrina recounts ...
7,646 views
Presented by Angela Zoss. This video is part of a series of lectures recorded to teach about basic data visualization concepts.
102 views
Try CodeCrafters for free using my referral link: https://app.codecrafters.io/join?via=trentpark8800 In this walkthrough, we dive into ...
90,661 views
116,663 views
Introduction to network analysis and visualization with GEPHI. Datasets and tutorial here: ...
111,460 views
Don't train your model without visualizing first! #MachineLearning #PythonTips #DataVisualization #Matplotlib #MLTraining ...
194 views
4 months ago
Excel Waterfall Chart: Beginner's Guide Learn how to create a waterfall chart in Excel with this beginner's guide! Waterfall charts ...
51,884 views


![Don’t Train Without This Step! Visualize Your Data in Python [3]](/api/proxy/image?url=https%3A%2F%2Fi.ytimg.com%2Fvi%2FLEQAxM_qeM4%2Fsddefault.jpg)
