ViewTube

ViewTube
Sign inSign upSubscriptions
Filters

Upload date

Type

Duration

Sort by

Features

Reset

5,357 results

Alex The Analyst
Best Resources to Learn Data Visualization in 2025

In this video we take a look at the best resources to learn Data Visualization in 2025! 25% off Analyst Builder Code: ...

4:28
Best Resources to Learn Data Visualization in 2025

15,984 views

9 months ago

TrentDoesMath
Is this FREE tool better than Power BI? | Apache Superset Overview

Try CodeCrafters for free using my referral link: https://app.codecrafters.io/join?via=trentpark8800 This video gives data ...

1:04:20
Is this FREE tool better than Power BI? | Apache Superset Overview

3,789 views

2 months ago

Alex The Analyst
Learn Databricks in Under 2 Hours

... IBM Data Analysis Specialization - https://coursera.pxf.io/AoYOdR Tableau Data Visualization - https://coursera.pxf.io/MXYqaN ...

1:40:15
Learn Databricks in Under 2 Hours

94,239 views

3 months ago

Blender
SciBlend: Advanced Data Visualization Workflows — Blender Conference 2025

"SciBlend: Advanced Data Visualization Workflows" by José Marín at Blender Conference 2025 Scientific data visualization is ...

18:54
SciBlend: Advanced Data Visualization Workflows — Blender Conference 2025

3,219 views

5 months ago

Geospatial Centroid
Data Visualization in R

An overview of data visualization techniques in R using the {ggplot2} package.

1:04:40
Data Visualization in R

130 views

6 months ago

Alex Followell | AI Automation
Turn CSVs into Charts & Insights in Seconds! (n8n)

Join the Skool AI Community – blueprints, tutorials, tools & expert help to level up fast! https://bit.ly/454oVuE Links ...

21:34
Turn CSVs into Charts & Insights in Seconds! (n8n)

11,547 views

9 months ago

Data Science Learning Community Videos
Fundamentals of Data Visualization: Visualizing uncertainty (dataviz01 16)

Gabby Palomo leads a discussion of Chapter 16 ("Visualizing uncertainty") from Fundamentals of Data Visualization by Claus O.

24:58
Fundamentals of Data Visualization: Visualizing uncertainty (dataviz01 16)

127 views

6 months ago

Data Science Learning Community Videos
Fundamentals of Data Visualization: Redundant coding & Multi-panel figures (dataviz01 20 21)

Gabby Palomo leads a discussion of Chapter 20 ("Redundant coding") and Chapter 21 ("Multi-panel figures") from Fundamentals ...

55:36
Fundamentals of Data Visualization: Redundant coding & Multi-panel figures (dataviz01 20 21)

54 views

4 months ago

Codanics
Data Visualization Workshop Live in urdu hindi for everyone A-Z

WELCOME to our real-time Data Visualization boot-camp! Whether you're a student, freelancer, or professional, this Urdu/Hindi ...

1:03:35
Data Visualization Workshop Live in urdu hindi for everyone A-Z

3,718 views

Streamed 7 months ago

SARA Institute of Data Science
Ihar Yanouski | Data Visualization using D3.js | Session - 1

SARA Institute was founded in April 2023 by Dr. Ajay Kumar Koli & Dr. Kiran Lata. How to Donate to SARA: UPI ID: ...

52:21
Ihar Yanouski | Data Visualization using D3.js | Session - 1

102 views

4 months ago

Data Science Learning Community Videos
Fundamentals of Data Visualization: Directory of visualizations & Color scales (dataviz01 5 4)

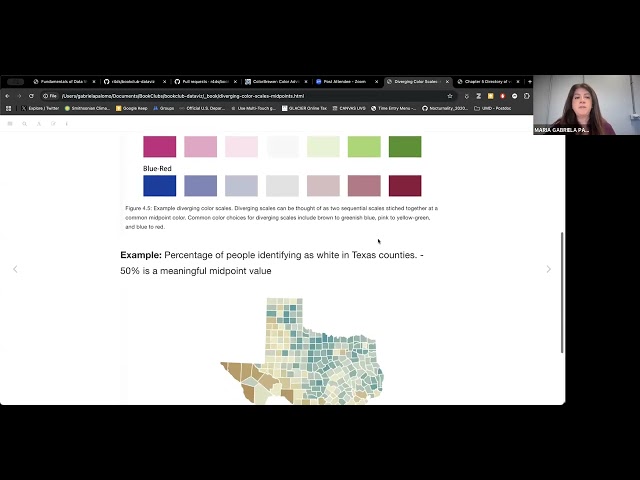
Gabby Palomo leads a discussion of Chapter 4 ("Color scales") and Chapter 5 ("Directory of visualizations") from Fundamentals of ...

42:44
Fundamentals of Data Visualization: Directory of visualizations & Color scales (dataviz01 5 4)

174 views

7 months ago

Data Science Learning Community Videos
Fundamentals of Data Visualization: Coordinate systems and axes (dataviz01 3)

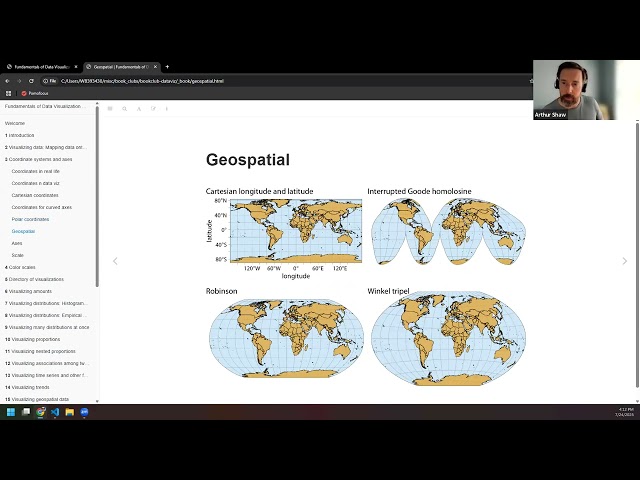
Arthur Shaw leads a discussion of Chapter 3 ("Coordinate systems and axes") from Fundamentals of Data Visualization by Claus ...

22:56
Fundamentals of Data Visualization: Coordinate systems and axes (dataviz01 3)

177 views

7 months ago

Codanics
Create Line Charts in Google Sheets | Data Visualization Tutorial

You can book One to one consultancy session with me on Mentoga: https://mentoga.com/muhammadaammartufail ...

1:59
Create Line Charts in Google Sheets | Data Visualization Tutorial

283 views

4 months ago

Neotoma devia
Stratigraphic data visualization and databasing with Tilia software

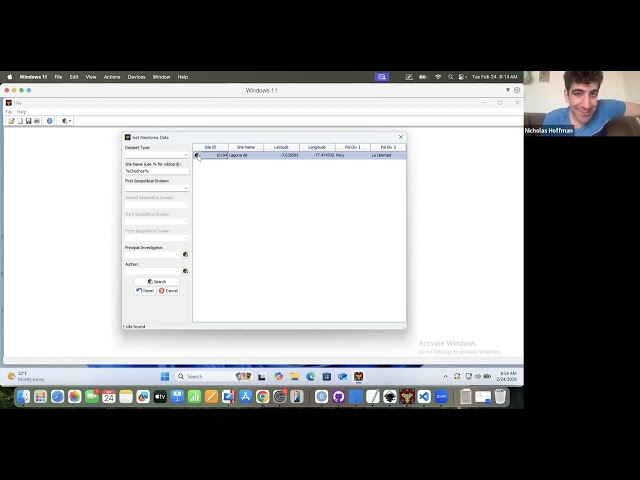
On February 24th, 2026, Nick Hoffman, data steward at the Neotoma Paleoecology Database, led a virtual workshop on using Eric ...

42:08
Stratigraphic data visualization and databasing with Tilia software

66 views

11 days ago

Codanics
Create a Scorecard Chart in Google Sheets | Data Visualization Tutorial

You can book One to one consultancy session with me on Mentoga: https://mentoga.com/muhammadaammartufail ...

8:01
Create a Scorecard Chart in Google Sheets | Data Visualization Tutorial

491 views

4 months ago

Data Science Learning Community Videos
Fundamentals of Data Visualization: Introduction (dataviz01 1)

Gabby Palomo leads a discussion of Chapter 1 ("Introduction") from Fundamentals of Data Visualization by Claus O. Wilke on ...

38:44
Fundamentals of Data Visualization: Introduction (dataviz01 1)

339 views

8 months ago

Codanics
Create a Scatter Plot in Google Sheets | Data Visualization Tutorial

You can book One to one consultancy session with me on Mentoga: https://mentoga.com/muhammadaammartufail ...

2:59
Create a Scatter Plot in Google Sheets | Data Visualization Tutorial

214 views

4 months ago

SFU Data & Dialogue Lab
Week 1 - Introduction to DATA VISUALIZATION through one piece, Silksong, and politics

In this video, we learn about the basics of visualization, and what this course will entail. Course is offered at SFU School of ...

58:49
Week 1 - Introduction to DATA VISUALIZATION through one piece, Silksong, and politics

376 views

6 months ago

Alex The Analyst
Working with Data in Databricks (Free Edition)

There a lot of ways that you will interact with data in Databricks! In this lesson we dive into connecting to data, the SQL Editor, and ...

13:17
Working with Data in Databricks (Free Edition)

20,510 views

4 months ago

Riffomonas Project
Imagining a 96 well plate as a data visualization of antibiotic resistance (CC394)

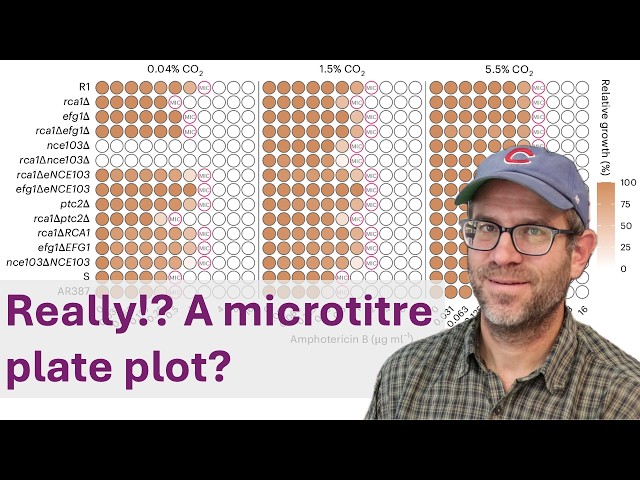
Pat critiques a figure from a paper published in the scientific journal Nature Microbiology that created a unique heatmap that ...

28:46
Imagining a 96 well plate as a data visualization of antibiotic resistance (CC394)

608 views

1 month ago