Upload date
All time
Last hour
Today
This week
This month
This year
Type
All
Video
Channel
Playlist
Movie
Duration
Short (< 4 minutes)
Medium (4-20 minutes)
Long (> 20 minutes)
Sort by
Relevance
Rating
View count
Features
HD
Subtitles/CC
Creative Commons
3D
Live
4K
360°
VR180
HDR
51,948 results
Explore how AI is revolutionizing data visualization and statistics, making complex data easier to understand and analyze.
56 views
1 year ago
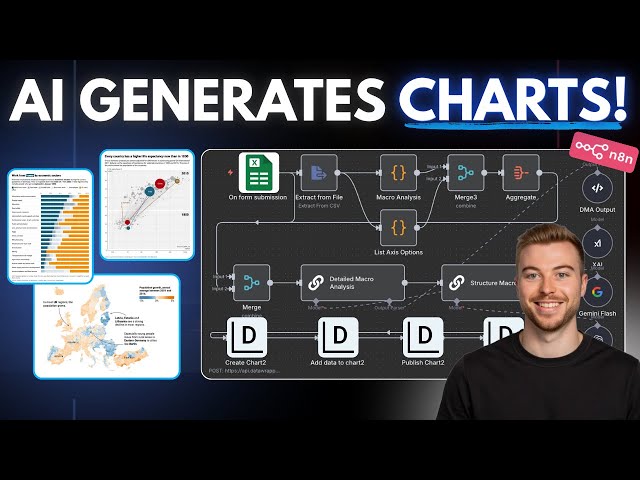
Turn plain text and research into real dashboards using Perplexity + Gemini — step-by-step 100% free. We'll grab structured ...
2,366 views
2 months ago
Sign up to Playfair+ http://bit.ly/4lgOeio - Discount code: TableauTim - Good for 10% discount at checkout. [ Affiliate Link ] My ...
2,186 views
1 month ago
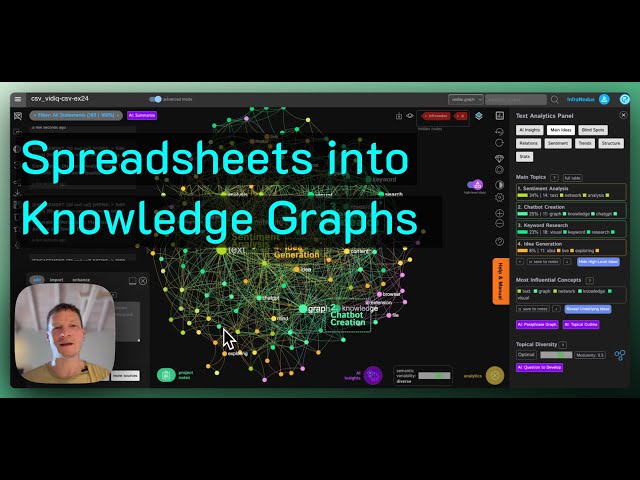
Using https://infranodus.com you can visualize the content of any CSV spreadsheet as a knowledge graph, so you can see the ...
2,518 views
In this video we are diving into Databricks! We will get hands-on and learn how to Work with our data, use SQL Editor and ...
90,089 views
3 months ago
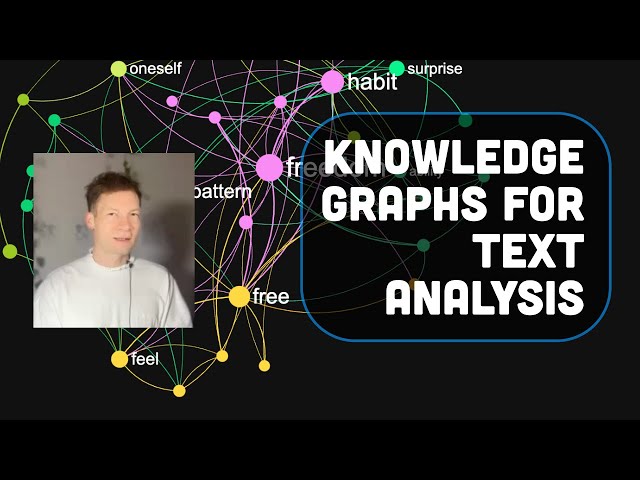
In this video, I will demonstrate how to use https://infranodus.com for text data visualization and analysis with AI. I will show how ...
2,329 views
... Data Analysis Specialization - https://coursera.pxf.io/AoYOdR Tableau Data Visualization - https://coursera.pxf.io/MXYqaN ...
26,669 views
2 years ago
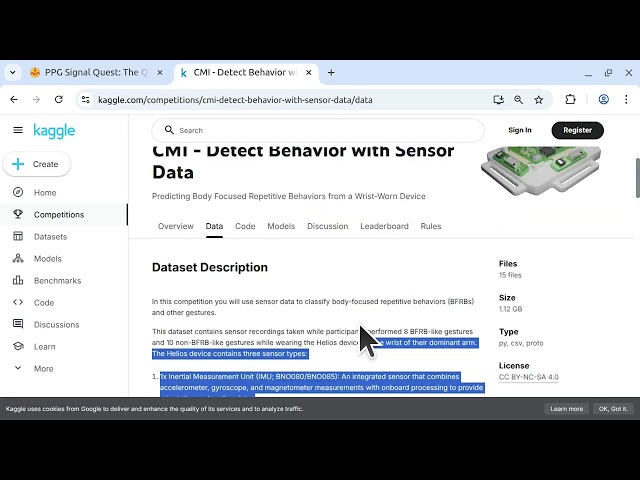
In this video, we explore biomedical data science by tackling the CMI Detect Behavior with Sensor Data challenge from Kaggle.
14 views
Greetings! I'm Mirko Trotta, a Germany-based Creative and Technology Consultant, bringing a fusion of Art Direction, Digital ...
6 views
Welcome back to Season 2 of The PhraSEOlogy + AI Show! In our premiere episode, we're thrilled to have Chloe Christine ...
45 views
Discover how the timeless Confucius quote: “I hear and I forget, I see and I remember, I do and I understand” applies to leveraging ...
17 views
11 months ago
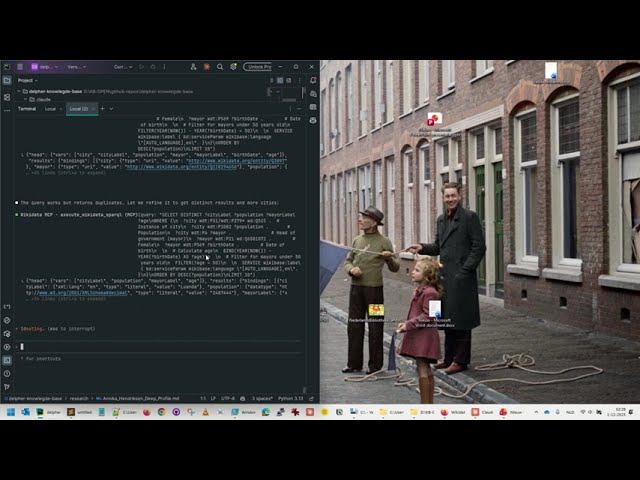
Watch an AI agent complete a complex multi-step task with just ONE prompt. In this video, Claude Code (powered by Claude ...
144 views
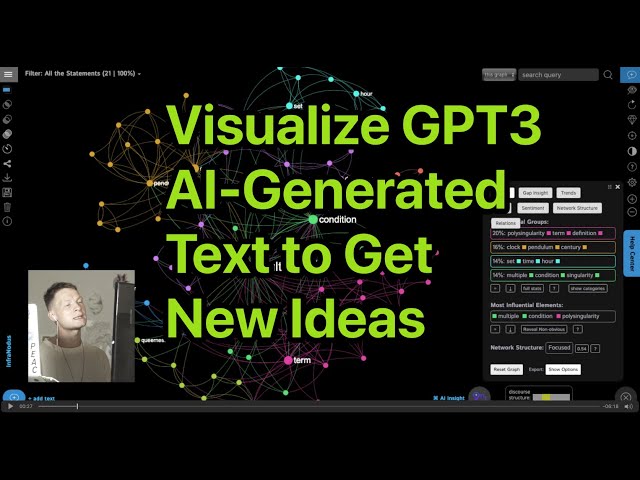
You can visualize the content generated by OpenAI's GPT3 as a text network graph using https://infranodus.com You can choose ...
3,014 views
3 years ago
My Courses on Linkedin Learning: https://www.linkedin.com/learning/instructors/tim-ngwena Boost your skills with DataCamp's ...
1,963 views
... IBM Data Analysis Specialization - https://coursera.pxf.io/AoYOdR Tableau Data Visualization - https://coursera.pxf.io/MXYqaN ...
122,958 views
Learn how easy it is to fine-tune models in Google's AI Studio with this quick tutorial. Whether it's classification, summarization, ...
9,267 views
Join the Skool AI Community – blueprints, tutorials, tools & expert help to level up fast! https://bit.ly/454oVuE Links ...
11,480 views
9 months ago
Description of this work is available here: https://github.com/galaxyproject/galaxy/pull/21586.
49 views
2 weeks ago
Access AI blueprints, tutorials, tools & expert help to level up fast! https://bit.ly/4lV67U2 Links Mentioned: - ⚡️ n8n: ...
2,345 views
7 months ago
#MinimaxAgent #AIHackathon #NoCode #DataAnalysis #BusinessIntelligence #React #DataVisualization #ArtificialIntelligence.
6 months ago
![AI can't do data analysis? Claude Cowork thinks different. [Un-edited]](/api/proxy/image?url=https%3A%2F%2Fi.ytimg.com%2Fvi%2FOTxSj9VKRG4%2Fsddefault.jpg)