Upload date
All time
Last hour
Today
This week
This month
This year
Type
All
Video
Channel
Playlist
Movie
Duration
Short (< 4 minutes)
Medium (4-20 minutes)
Long (> 20 minutes)
Sort by
Relevance
Rating
View count
Features
HD
Subtitles/CC
Creative Commons
3D
Live
4K
360°
VR180
HDR
12,307 results
Debugging Tools and Techniques for Virtualized/Containerized Automotive Systems - Hiroyuki Ishii, Panasonic Automotive ...
478 views
2 years ago
In this video Dante will show Universal Windows app developers how to take advantage of the powerful debugging features in ...
9,311 views
10 years ago
If you're still using console.log() to find and fix JavaScript issues, you might be spending more time debugging than you need to.
907,430 views
8 years ago
... Robert is joined by Leslie Richardson, who shows several ways you can get the most out of Visual Studio's debugging tools.
34,398 views
6 years ago
We will also see the FIRST reveal of a new 3Dfx debugging tool called 'Witchery'. This tool is able to perform low-level diagnostics ...
19,415 views
1 year ago
Sumantro Mukherjee from Red Hat shows how Toolbx helps you debug your project, test different use cases and keep your base ...
188 views
Discover 5 different ways to debug your code beyond console.log - Discover the breakpoints, debugger statements, logpoints, ...
45,573 views
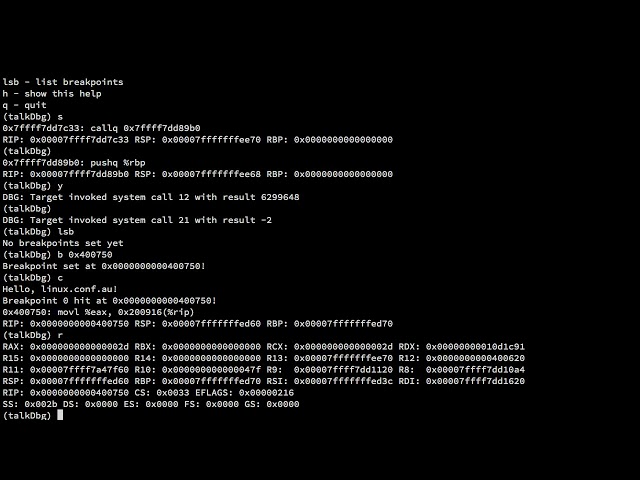
Levente Kurusa http://lca2018.linux.org.au/schedule/presentation/91/ Ever wondered how does the ever-famous gdb tool work?
10,021 views
In this video Dante will show you how to take advantage of more advance tools in Visual Studio 2015 that make resolving even ...
5,012 views
Tools and Techniques to Debug an Embedded Linux System - Sergio Prado, Embedded Labworks [Presented in English]
615 views
3 years ago
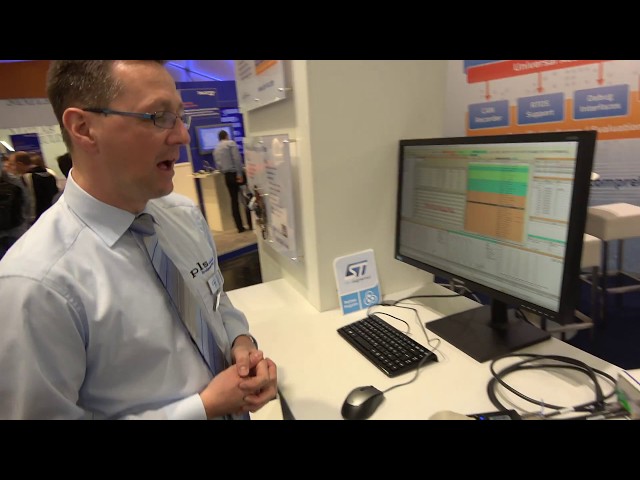
... part the software running on the microcontroller we are bringing to the customers and the customers use our tools to our debug ...
211 views
5 years ago
Barry joins Jecelyn again to explain how to record a trace in the Performance panel and debug LCP and CLS issues using the ...
34,076 views
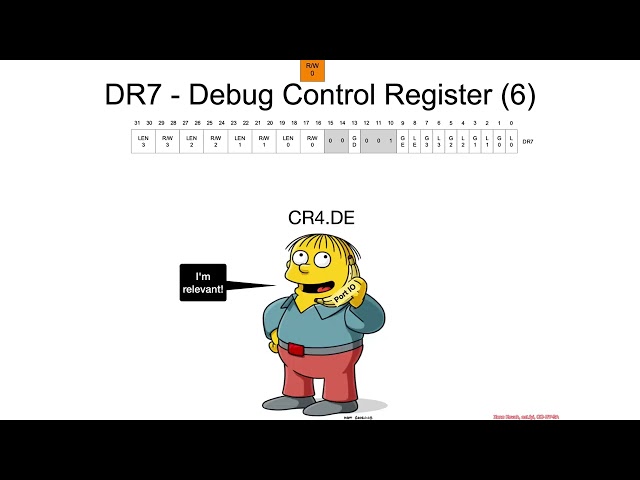
You can watch this class without ads and with quizzes and lab setup instructions by going to https://ost2.fyi/Arch2001.
1,205 views
A good way to start investigating performance issues in your app is to understand its CPU usage. Profiler PM Esteban Herrera ...
31,665 views
Developers use frameworks, multiple languages, and libraries to build their web applications. Browsers only see the resulting ...
10,735 views
Mentor: Joel Fernandes, Staff Software Engineer, Google In this enlightening webinar, "Linux Kernel Debugging Tricks of the ...
15,159 views
It is less about squashing bugs but more about answering the question "what happened" that a nasty product manager or ...
2,925 views
9 years ago
Learn how to use the most popular Chrome DevTools features related to inspecting network activity, including: 1:05 - View a ...
403,165 views
Most of us have to make our web pages work in The Big Five browsers, so I thought it was about time I introduce you to the ...
179 views
11 years ago
13,470 views