Upload date
All time
Last hour
Today
This week
This month
This year
Type
All
Video
Channel
Playlist
Movie
Duration
Short (< 4 minutes)
Medium (4-20 minutes)
Long (> 20 minutes)
Sort by
Relevance
Rating
View count
Features
HD
Subtitles/CC
Creative Commons
3D
Live
4K
360°
VR180
HDR
39,654 results
Take my Full Excel for Data Analytics Course! https://www.analystbuilder.com/courses/excel-for-data-analytics In this video we ...
1,169,843 views
3 years ago
#exceldashboard #ChatGPT #ExcelTips #ExcelAutomation #DataVisualization #MicrosoftExcel #ProductivityHacks #AIInExcel ...
415 views
11 months ago
ChatGPT is revolutionizing the way we work with data. This video will demonstrate how to leverage its power to transform complex ...
34 views
Simple techniques - using Excel and other tools - can help you to visualize data and present information clearly and effectively.
42 views
9 years ago
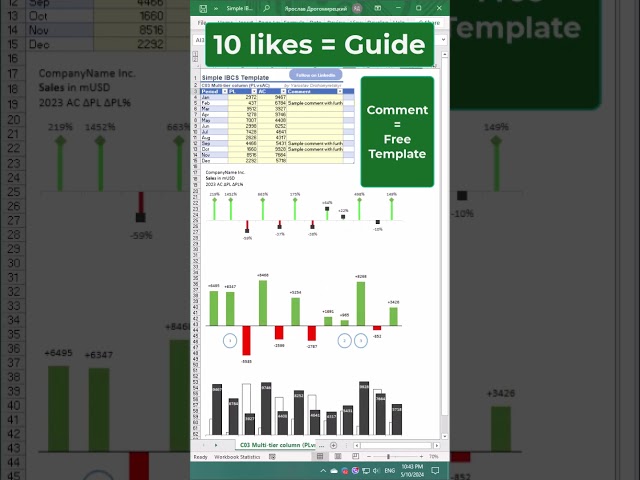
Chart Template for Plan vs Actual Comparisons: Showcase Simple IBCS-Style Chart Template ...
1,732 views
1 year ago
Excel Waterfall Chart: Beginner's Guide Learn how to create a waterfall chart in Excel with this beginner's guide! Waterfall charts ...
43,427 views
Take my Full Excel Course Here: https://www.analystbuilder.com/courses/excel-for-data-analytics Download Datasets: ...
123,753 views
In this Microsoft Excel tutorial, you'll learn how to make great data visualizations in Excel. Learn and master the art of creating a ...
399 views
Learn how to master Excel skills by learning both basic and extended data visualization and business intelligence related ...
124 views
Take my Full Excel for Data Analytics Course! https://www.analystbuilder.com/courses/excel-for-data-analytics Excel is one of the ...
779,076 views
In Ms excel you can Interactive Dashboard in Ms Excel | Data Visualization in Ms Excel | Create Dashboard in Excel Ease, we ...
127 views
4 years ago
Did you know you can use the pandas Python library inside Microsoft Excel to conduct advanced statistical modeling? Watch here ...
42,695 views
2 years ago
In this video I demonstrate how to create a boxplot using Microsoft Excel 365.
76,368 views
6 years ago
1,178,991 views
Enhanced Data Visualization with 3D Line Charts 3D Line Charts for Data Insights Discover the power of 3D line charts for ...
49 views
In the realm of Excel's powerful features lies a tool that transforms raw data into insightful visual representations - Charts. When it ...
55 views
588,825 views
... excel so to do that let's jump on over to our main page here and first thing you're going to want to do is just open up the data file ...
284 views
5 years ago
Excel Chart Cleaning Tips Effective data visualization is crucial for conveying information. While Excel ...
135 views
How to Change Theme Colors in Excel Want to customize the look of your Excel spreadsheets? Learn how to change theme ...
3,269 views