Upload date
All time
Last hour
Today
This week
This month
This year
Type
All
Video
Channel
Playlist
Movie
Duration
Short (< 4 minutes)
Medium (4-20 minutes)
Long (> 20 minutes)
Sort by
Relevance
Rating
View count
Features
HD
Subtitles/CC
Creative Commons
3D
Live
4K
360°
VR180
HDR
37,744 results
Take my Full Excel for Data Analytics Course! https://www.analystbuilder.com/courses/excel-for-data-analytics In this video we ...
1,174,774 views
3 years ago
Simple techniques - using Excel and other tools - can help you to visualize data and present information clearly and effectively.
42 views
9 years ago
Take my Full Excel Course Here: https://www.analystbuilder.com/courses/excel-for-data-analytics Download Datasets: ...
126,478 views
1 year ago
Excel is one of the most used skills in the data world. In this series we will be walking through all of the most important topics that ...
213,580 views
4 years ago
In this Microsoft Excel tutorial, you'll learn how to make great data visualizations in Excel. Learn and master the art of creating a ...
399 views
Take my Full Excel for Data Analytics Course! https://www.analystbuilder.com/courses/excel-for-data-analytics Excel is one of the ...
782,258 views
Learn how to master Excel skills by learning both basic and extended data visualization and business intelligence related ...
124 views
Errata: at 46:20 -- you type the name of the file -- should say: -- you type the command "barplot" first. -- NOTE: audio is left channel ...
1,330 views
6 years ago
1,186,505 views
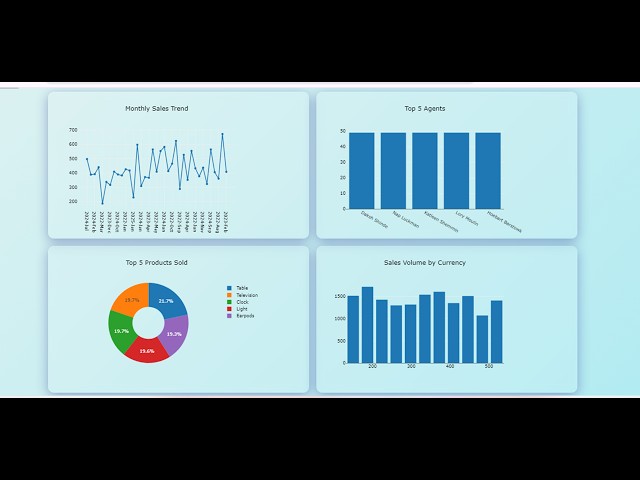
In Ms excel you can Interactive Dashboard in Ms Excel | Data Visualization in Ms Excel | Create Dashboard in Excel Ease, we ...
127 views
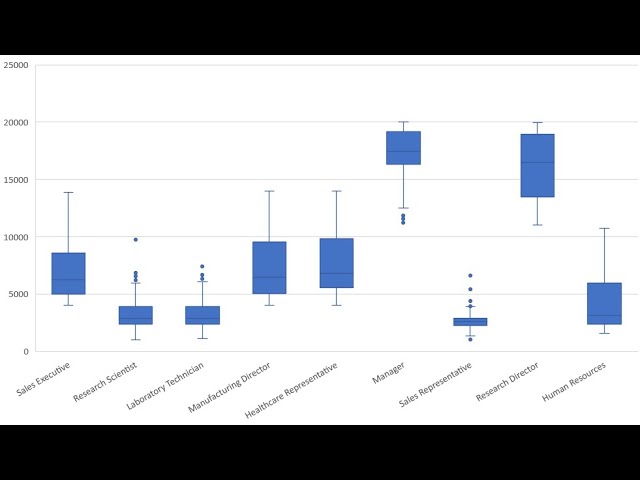
In this video I demonstrate how to create a boxplot using Microsoft Excel 365.
76,451 views
Check out all my Full Courses on Analyst Builder: https://www.analystbuilder.com/ 25% Off Analyst Builder Code: BOOTCAMP In ...
974,893 views
Excel Charts 101: Best Practices for Clean and Effective Charts In this tutorial, you will learn: How to properly organize your data ...
304 views
Better Data Visualization Using Excel Simple techniques - using Excel and other tools - can help you to visualize data and present ...
32 views
How to visualize data through 3D Map on MS-Excel has been shown throughout the video.
22 views
2 years ago
592,310 views
This visualisation shows one of the ways by which data from the Wait Advisor app can be presented: a heatmap as a function of ...
97 views
7 years ago
This technique unpivots Microsoft Forms data in Power Query to combine responses into a single column in Power BI. This lets us ...
28,223 views
exceldashboardstutorial #excelskills #excelforbeginners Prompt 1 This is the structure of my sales data in JSON format.
479 views
11 months ago
... excel so to do that let's jump on over to our main page here and first thing you're going to want to do is just open up the data file ...
284 views
5 years ago


![Ultimate Data Analyst Bootcamp [24 Hours!] for FREE | SQL, Excel, Tableau, Power BI, Python, Azure](/api/proxy/image?url=https%3A%2F%2Fi.ytimg.com%2Fvi%2FwQQR60KtnFY%2Fsddefault.jpg)