ViewTube

ViewTube
Sign inSign upSubscriptions
Filters

Upload date

Type

Duration

Sort by

Features

Reset

831 results

Creative Suite Studio
3 Secrets EXPERTS Use to Insert Maps into MS Excel Spreadsheets

3 Secrets EXPERTS Use to Insert Maps into MS Excel Spreadsheets | Easy Step-by-Step Guide Description: Want to make your ...

3:27
3 Secrets EXPERTS Use to Insert Maps into MS Excel Spreadsheets

52 views

10 months ago

Analytics Advisors
57. Transform Boring Pivot Charts into Stunning Visuals in Excel 🎨

Welcome to Analytics Advisors – your comprehensive learning hub for mastering data analytics, data visualization, and business ...

7:27
57. Transform Boring Pivot Charts into Stunning Visuals in Excel 🎨

14,930 views

4 months ago

Analytic Endeavors
Must Know Tips when Connecting Excel to Power BI Semantic Models

After building Power BI Semantic Models, allowing users to connect via Excel can greatly increase usage. In this video we will ...

7:15
Must Know Tips when Connecting Excel to Power BI Semantic Models

15,483 views

10 months ago

Alex Followell | AI Automation
Turn CSVs into Charts & Insights in Seconds! (n8n)

Join the Skool AI Community – blueprints, tutorials, tools & expert help to level up fast! https://bit.ly/454oVuE Links ...

21:34
Turn CSVs into Charts & Insights in Seconds! (n8n)

11,446 views

9 months ago

TrentDoesMath
Is this FREE tool better than Power BI? | Apache Superset Overview

Try CodeCrafters for free using my referral link: https://app.codecrafters.io/join?via=trentpark8800 This video gives data ...

1:04:20
Is this FREE tool better than Power BI? | Apache Superset Overview

3,241 views

2 months ago

360 CodeCamp
Excel Chart Mastery: Transforming Data into Visual Insights

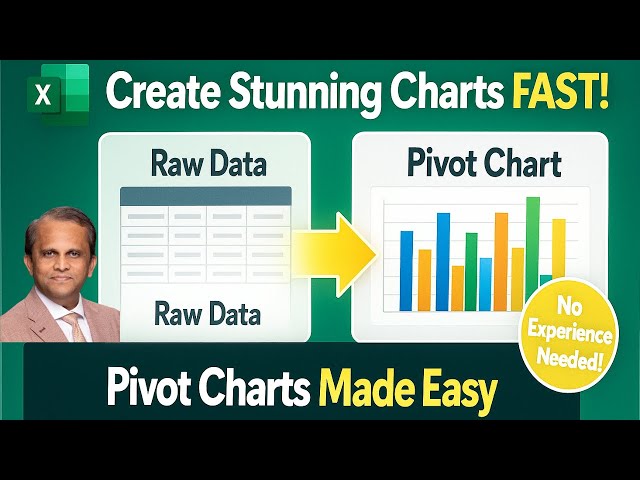
Unlock the power of visual communication and transform your raw Excel data into compelling, insightful charts with our ...

1:21:00
Excel Chart Mastery: Transforming Data into Visual Insights

60 views

11 months ago

Analytics Advisors
70. Stop Using Confusing Charts! Create Powerful Stacked Charts in Excel

My Microsoft Excel Playlist: https://www.youtube.com/playlist?list=PLHrw3fxxgFBRyH308kfvRZnAIevkaKkf0 Join Whatsapp group: ...

8:21
70. Stop Using Confusing Charts! Create Powerful Stacked Charts in Excel

13,388 views

1 month ago

Analytics Advisors
75. Master Donut Charts in Excel in 4 Minutes 🔥

My Microsoft Excel Playlist: https://www.youtube.com/playlist?list=PLHrw3fxxgFBRyH308kfvRZnAIevkaKkf0 Join Whatsapp group: ...

3:57
75. Master Donut Charts in Excel in 4 Minutes 🔥

23,537 views

1 month ago

Creative Suite Studio
3 Simple Tricks to Master Converting TEXT to Chart in Excel

3 Simple Tricks to Master Converting TEXT to Chart in Excel Are you tired of manually creating charts in Excel? Do you want to ...

4:33
3 Simple Tricks to Master Converting TEXT to Chart in Excel

46 views

10 months ago

Analytics Advisors
74. Excel Pie Chart Explained | When & How to Use It Properly.

My Microsoft Excel Playlist: https://www.youtube.com/playlist?list=PLHrw3fxxgFBRyH308kfvRZnAIevkaKkf0 Join Whatsapp group: ...

5:01
74. Excel Pie Chart Explained | When & How to Use It Properly.

19,788 views

1 month ago

Analytics Advisors
82. Most Excel Users Have Never Used Sunburst Charts 😱 (Watch This!)

... avoid common Excel Sunburst chart mistakes! Like | Comment | Subscribe for more Excel & Data Visualization tutorials ...

5:53
82. Most Excel Users Have Never Used Sunburst Charts 😱 (Watch This!)

11,732 views

2 weeks ago

Analytics Advisors
73. Excel 3-D Column vs 3-D Bar Chart | Complete Beginner Guide

My Microsoft Excel Playlist: https://www.youtube.com/playlist?list=PLHrw3fxxgFBRyH308kfvRZnAIevkaKkf0 Join Whatsapp group: ...

3:51
73. Excel 3-D Column vs 3-D Bar Chart | Complete Beginner Guide

10,982 views

1 month ago

Analytics Advisors
4. Learn Microsoft Excel References the Right Way – Most People Get This Wrong!

Welcome to Analytics Advisors – your comprehensive learning hub for mastering data analytics, data visualization, and business ...

15:23
4. Learn Microsoft Excel References the Right Way – Most People Get This Wrong!

66,226 views

8 months ago

yusakru
AI Agent Converts Messy CSV to Report in 30 Seconds (Minimax Hackathon Project)

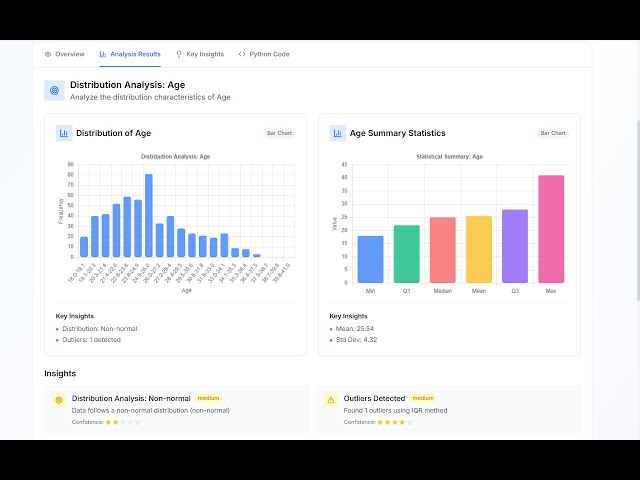
#MinimaxAgent #AIHackathon #NoCode #DataAnalysis #BusinessIntelligence #React #DataVisualization #ArtificialIntelligence.

1:10
AI Agent Converts Messy CSV to Report in 30 Seconds (Minimax Hackathon Project)

56 views

6 months ago

Analytics Advisors
77. Excel Line Chart: The Secret Tool Top Analysts Use (2026 Guide)

... Excel Line chart mistakes! Like | Comment | Subscribe for more Excel & Data Visualization tutorials #Excel #LineChart ...

4:27
77. Excel Line Chart: The Secret Tool Top Analysts Use (2026 Guide)

9,099 views

1 month ago

Analytics Advisors
69. Master Clustered Bar Charts in Excel in 5 Minutes 🔥

My Microsoft Excel Playlist: https://www.youtube.com/playlist?list=PLHrw3fxxgFBRyH308kfvRZnAIevkaKkf0 Join Whatsapp group: ...

5:09
69. Master Clustered Bar Charts in Excel in 5 Minutes 🔥

15,127 views

1 month ago

SARA Institute of Data Science
Natalia Kiseleva | Data Visualization using Excel Session 3-4

SARA Institute was founded in April 2023 by Dr. Ajay Kumar Koli & Dr. Kiran Lata. How to Donate to SARA: UPI ID: ...

1:02:22
Natalia Kiseleva | Data Visualization using Excel Session 3-4

34 views

7 months ago

SARA Institute of Data Science
Natalia Kiseleva | Data Visualization using Excel Session 4-4

SARA Institute was founded in April 2023 by Dr. Ajay Kumar Koli & Dr. Kiran Lata. How to Donate to SARA: UPI ID: ...

1:02:22
Natalia Kiseleva | Data Visualization using Excel Session 4-4

51 views

7 months ago

Analytics Advisors
56. How to Create Pivot Charts in Excel | The Easiest Guide Ever!

Welcome to Analytics Advisors – your comprehensive learning hub for mastering data analytics, data visualization, and business ...

4:22
56. How to Create Pivot Charts in Excel | The Easiest Guide Ever!

18,078 views

4 months ago

SARA Institute of Data Science
Natalia Kiseleva | Data Visualization using Excel Session 1-4

SARA Institute was founded in April 2023 by Dr. Ajay Kumar Koli & Dr. Kiran Lata. How to Donate to SARA: UPI ID: ...

55:33
Natalia Kiseleva | Data Visualization using Excel Session 1-4

101 views

7 months ago