Upload date
All time
Last hour
Today
This week
This month
This year
Type
All
Video
Channel
Playlist
Movie
Duration
Short (< 4 minutes)
Medium (4-20 minutes)
Long (> 20 minutes)
Sort by
Relevance
Rating
View count
Features
HD
Subtitles/CC
Creative Commons
3D
Live
4K
360°
VR180
HDR
1,158 results
Looking to explore data sources in Looker Studio and Power BI? Join us in this comprehensive tutorial as we compare and ...
315 views
1 year ago
Our CEO Flynn Zaiger goes into how to solve the Looker Studio error you're likely seeing the last week of June, 2024. If you're ...
31 views
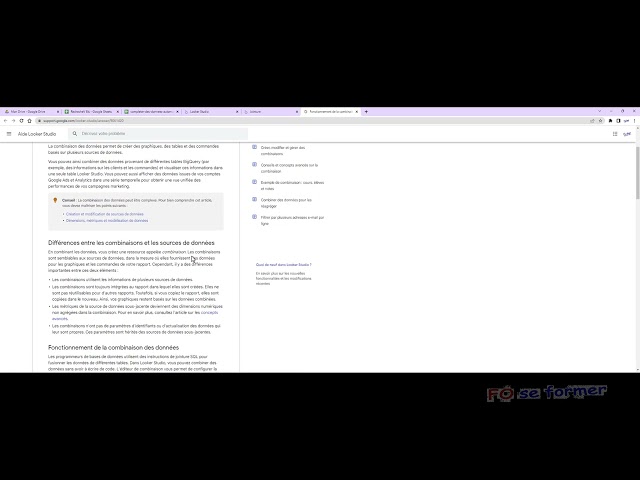
Dans un rapport Google Looker Studio, il est possible d'avoir plusieurs sources de données. Du coup nous pouvons créer une ...
5,108 views
3 years ago
Understanding Users Better at Scale with Google Looker Studio / Web Tools & Technologies / Scott Massey === Time: Wed, ...
125 views
2 years ago
Il est possible de créer des champs calculés dans un rapport mais il y a des limites en terme de réutilisation (voir précédente ...
2,758 views
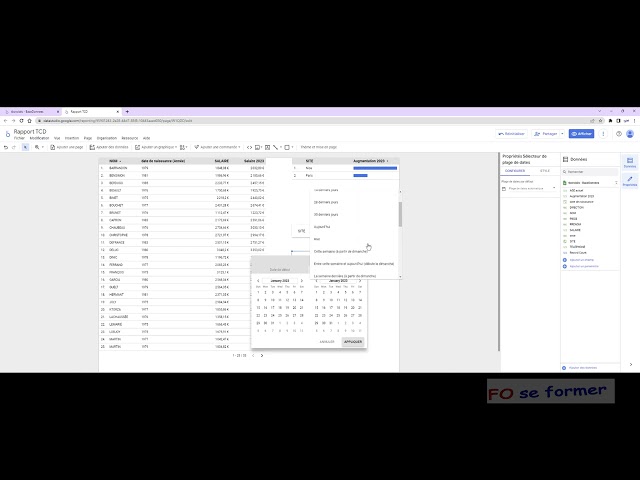
Dans Looker Studio, ex Data Studio, on peut souhaiter filtrer ses graphiques sur une plage de dates ou avec une liste déroulante.
3,048 views
436 views
5 years ago
فى الفيديو ده هنتعلم مع بعض ازاى نبدأ فى Looker Studio من الصفر، هنعمل حساب جديد خطوة بخطوة، وبعد كده نربط مصدر بيانات Google ...
1,099 views
3 months ago
In this video, let us learn how we can create a beautiful horizontal menu using Tree map visualisation Let's connect on social: ...
235 views
It's no secret that Mautic's 'Reports' feature often falls short in providing the insights you're looking for and lacks robust ...
174 views
Clip from The Easy Guide to Data Storytelling with Google DataStudio with TechSoup Connect BC.d.
500 views
4 years ago
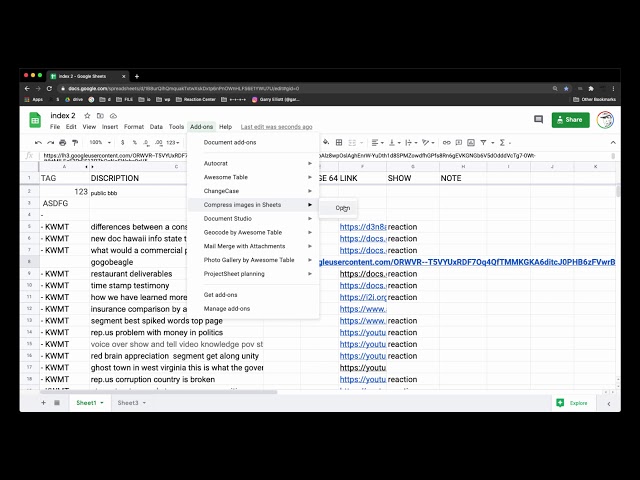
Il arrive que les données viennent de plusieurs sources : Google ADS, YouTube, SQL, CSV, Google Sheets, SQL Server, .
2,970 views
Can't connect Google LookerStudio to Amazon Aurora serverless PostgreSQL I hope you found a solution that worked for you ...
216 views
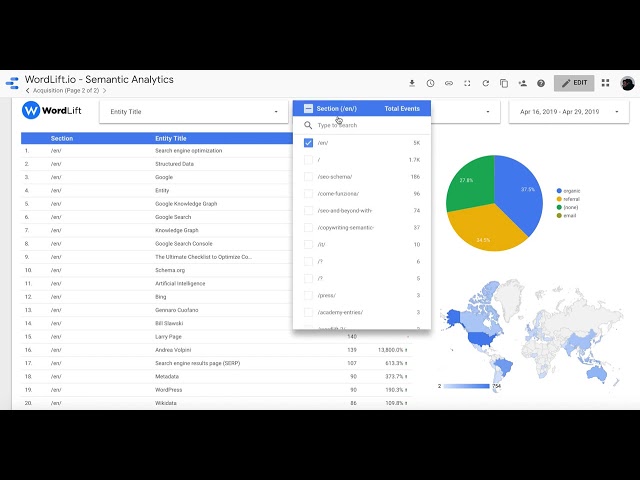
Semantic Web Analytics is the use of named entities and linked vocabularies such as schema.org to analyze the traffic of a ...
447 views
6 years ago
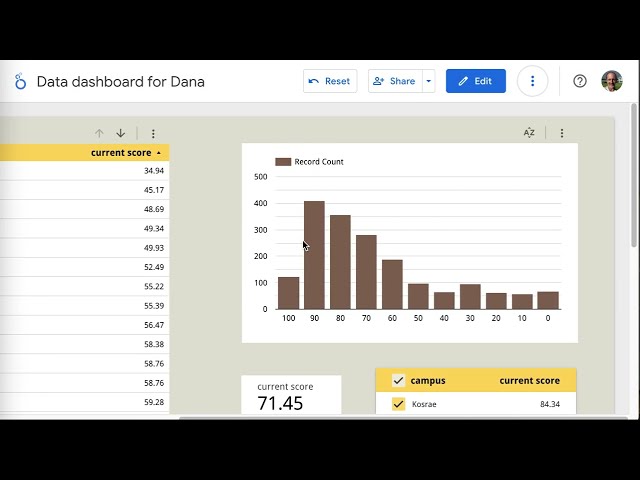
A video for students in a statistics course to take them through building their very first data dashboard using Google Sheets and ...
220 views
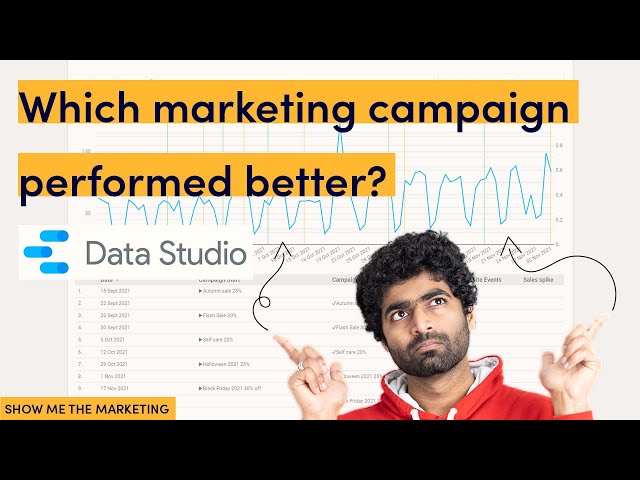
If you run a lot of marketing campaigns in a year, you might feel that it's hard to understand how each marketing campaign ...
753 views
During this presentation, we will talk about overview of Looker Hub and Spoke modelling and accompanying organizational ...
167 views
What's the best way to prioritize high-value, low-complexity tasks? This tutorial teaches you how easy it is to build a prioritization ...
786 views
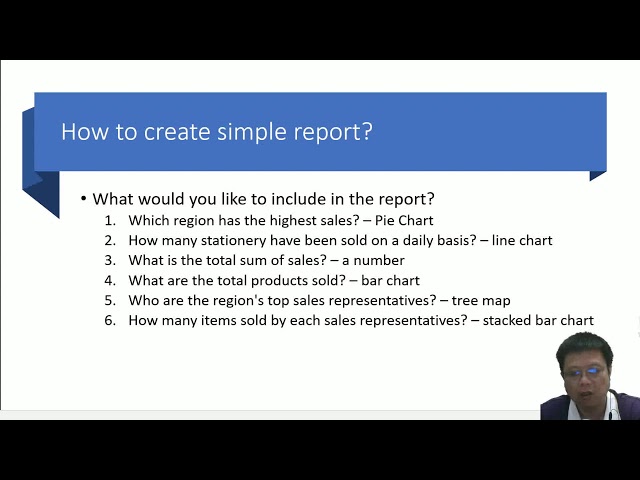
I've addressed the importance of understanding data, connecting the Google Sheet Data Source, and making a simple report ...
126 views
Imagine a tool so powerful it could turn the raw, untamed data of Overton County into a crystal-clear window of insight—a tool that ...
20 views