Upload date
All time
Last hour
Today
This week
This month
This year
Type
All
Video
Channel
Playlist
Movie
Duration
Short (< 4 minutes)
Medium (4-20 minutes)
Long (> 20 minutes)
Sort by
Relevance
Rating
View count
Features
HD
Subtitles/CC
Creative Commons
3D
Live
4K
360°
VR180
HDR
170,535 results
I'm very excited to welcome our next team talk uh from the amazing bloomberg visual data team i'm so excited to have him here ...
656 views
11 years ago
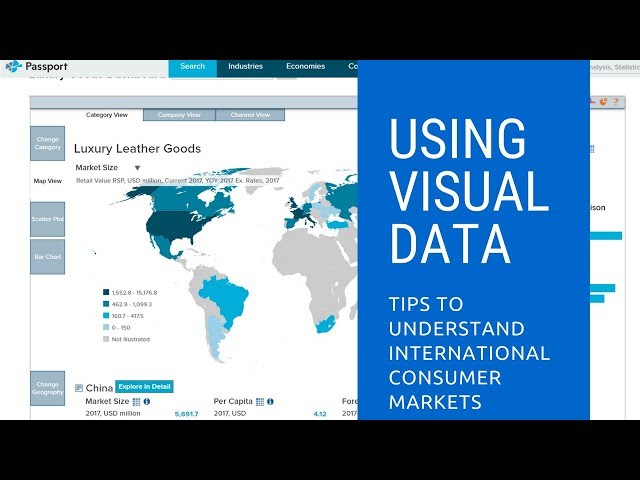
It's easy to get overwhelmed when researching international markets for consumer product categories. Euromonitor's Passport ...
420 views
7 years ago
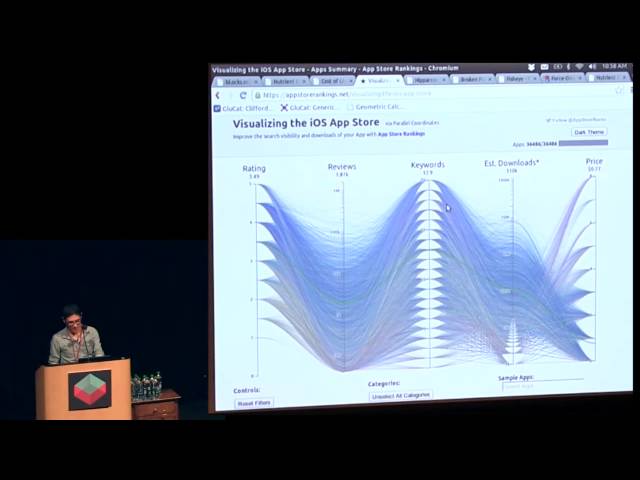
We will explore datasets like these by interacting with parallel coordinates: discovering relationships, identifying outliers, and ...
25,967 views
12 years ago
Take my Full Power BI Course Here: https://www.analystbuilder.com/courses/microsoft-power-bi-desktop-for-business-intelligence ...
212,088 views
3 years ago
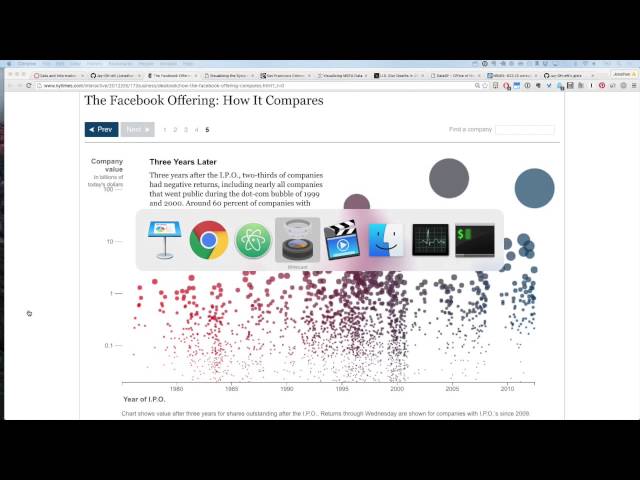
NYC Open Data Week 2022 - Mar 12 2022 Have you ever felt trapped by only having a few chart types to choose from in your ...
67 views
CMU Database Group - Vaccination Database Tech Talks - Booster (2022) Speakers: Vishakha Gupta (ApertureDB) March 7, ...
1,403 views
Presented by David Christensen. This video is part of a series of lectures recorded to teach about basic data visualization ...
154 views
4 years ago
Presented by Jeff Hemsley, Associate Professor & Director of the Center for Computational & Data Science (CCDS) at the ...
2,907 views
A two-part short lecture on visualization of data: basic visual design principles, bad examples and what Edward Tufte calls "the lie ...
345 views
5 years ago
Some examples of best practices and some things to avoid when producing data visualisations.
202 views
Recordings from the University of San Francisco's Spring 2016 MSAN 622 course: Introduction to Data and Information ...
426 views
9 years ago
Things aren't always what they seem! Things are not always as they seem! thangaraj tales, discovery, friendship, love and fate ...
1 view
7 months ago
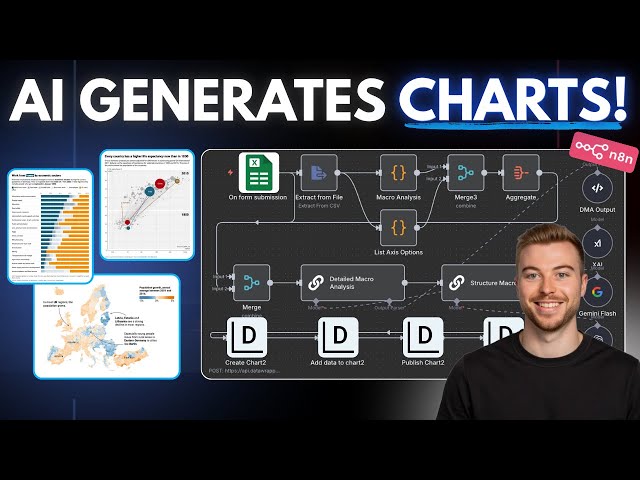
Access AI blueprints, tutorials, tools & expert help to level up fast! https://bit.ly/4lV67U2 Links Mentioned: - ⚡️ n8n: ...
2,142 views
6 months ago
Every day we perceive many visual impressions. We can differentiate a multitude of colors in a bunch of flowers, and we can ...
204,508 views
Libraries have long collected data and aspired to present this information in a compelling and clear manner. In this session, the ...
379 views
10 years ago
We are sorry for the late upload,there are some connection problem yesterday that make us late to upload, please enjoy This ...
219 views
This technique unpivots Microsoft Forms data in Power Query to combine responses into a single column in Power BI. This lets us ...
28,500 views
1 year ago
WordPress 4.7's integrated REST API just gave us easy access to the public data of millions of sites. We, as designers, can now ...
60 views
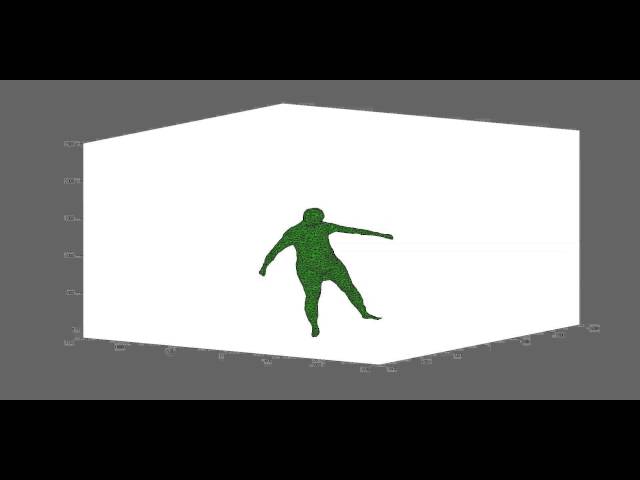
Human motion capture results from the Human Eva II data set using search space decomposition technique (to be sent to ICCV ...
13 years ago
https://newhorizons123.com/what-is-visual-storytelling/ Visual storytelling is just like our daily communication with others.
3,914 views
2 years ago