Upload date
All time
Last hour
Today
This week
This month
This year
Type
All
Video
Channel
Playlist
Movie
Duration
Short (< 4 minutes)
Medium (4-20 minutes)
Long (> 20 minutes)
Sort by
Relevance
Rating
View count
Features
HD
Subtitles/CC
Creative Commons
3D
Live
4K
360°
VR180
HDR
10,270 results
Access AI blueprints, tutorials, tools & expert help to level up fast! https://bit.ly/4lV67U2 Links Mentioned: - ⚡️ n8n: ...
2,142 views
6 months ago
Things aren't always what they seem! Things are not always as they seem! thangaraj tales, discovery, friendship, love and fate ...
1 view
7 months ago
Get 40% OFF CodeCrafters: https://app.codecrafters.io/join?via=the-coding-gopher ⬆️ Best project-based coding platform.
491,230 views
9 months ago
Animated Business Growth Chart Loop | Data Visualization | Upward Trend Bar Graph 4K Looking for professional motion ...
111 views
2 months ago
Microsoft just released the Official Power BI Model Context Protocol (MCP) to connect Power BI to your AI models. This guide ...
38,269 views
Unlocking the Emotional Power of Data Visualisation and Storytelling | World Data Summit Talk How can we make data mean ...
55 views
3 months ago
The Nintendo 3DS has one of the best game libraries of all time. But just like the Wii U, its facing a serious issue with preservation.
119,060 views
Learn how to use xUnit Theory attributes in your .NET unit tests to write cleaner, more powerful test cases. In this video, we cover: ...
545 views
4 months ago
#educationtools #voxdeck #visualdata #startuptools #3dcharts #voxtechreview #voxtechfeatures #aitoolsforpresentations ...
9,156 views
In this video, we break down the concept of OFDM (Orthogonal Frequency Division Multiplexing)—a key technology behind Wi-Fi, ...
44,644 views
8 months ago
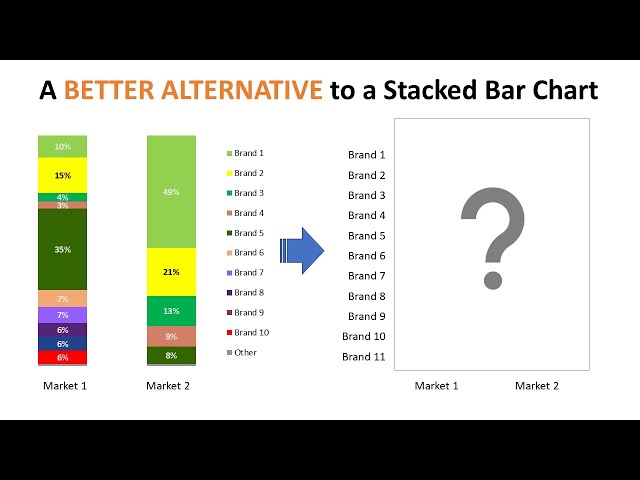
In this video, I showcase an alternate and visual way to show staked bar chart data. See what more you can do with this playlist: ...
276 views
10 months ago
As the motion designer for the Technology Trailer Green Screen, I developed this comprehensive toolkit to provide a sophisticated ...
3 weeks ago
78 views
102 views
In this video, we'll explore how to perform data comparisons using Visual Studio 2017 through the command line. Whether you're ...
2 views
Unlock the power of visual communication and transform your raw Excel data into compelling, insightful charts with our ...
60 views
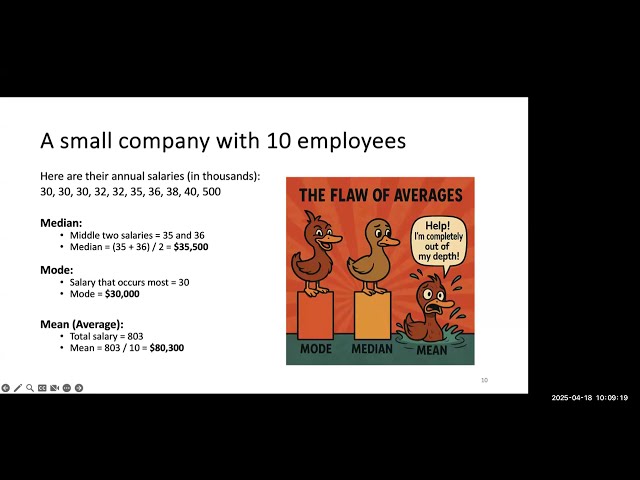
... bestseller and translated into all kinds of different languages and such but every day we are surrounded by visual data and Huff ...
51 views
Spring College in the Physics of Complex Systems | (smr 4056) Speaker: Zhaoping Li (University of Tübingen, Max Planck ...
158 views
11 months ago
In this livestream, Pat critiques a recent data visualization that was tweeted out by the White House and answered questions about ...
480 views
Streamed 2 days ago
Neon Line Graph Animation | Stock Market & Business Chart Template | Data Visualization Visualize your data with impact using ...
37 views
5 months ago


![Official Power BI MCP - Quick Start Guide [Nov 2025]](/api/proxy/image?url=https%3A%2F%2Fi.ytimg.com%2Fvi%2F0ZRDTZm1iaI%2Fsddefault.jpg)