Upload date
All time
Last hour
Today
This week
This month
This year
Type
All
Video
Channel
Playlist
Movie
Duration
Short (< 4 minutes)
Medium (4-20 minutes)
Long (> 20 minutes)
Sort by
Relevance
Rating
View count
Features
HD
Subtitles/CC
Creative Commons
3D
Live
4K
360°
VR180
HDR
133 results
Want to know how to calculate the right manpower for your project? In this video, we'll break down how productivity, average ...
3,936 views
10 months ago
In the listwise deletion, we delete the IQ values that we have, even if we could use those for calculating the mean, and this is the ...
8,618 views
5 years ago
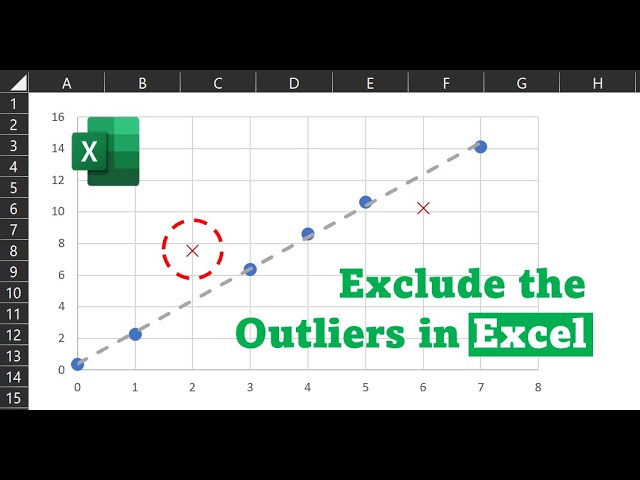
This video demonstrates one approach to showing outliers on calibration graphs without hiding them. This is specifically for how ...
23,910 views
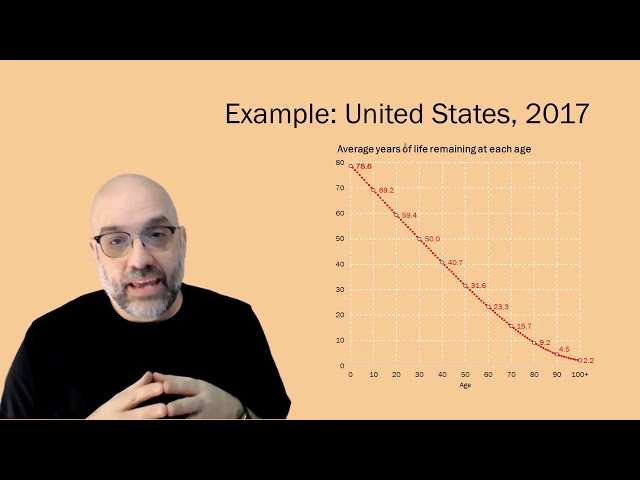
Demographer Philip N. Cohen explains, with a simple example using real data.
18,754 views
In this video, we will explore a practical approach to calculating the average of DataFrame rows that meet a specific condition: ...
2 views
1 year ago
Chapters: 0:00 Introduction 1:03 Exercise data 2:29 DATA MODEL design 11:01 Add MEASURES & build a REPORT 15:21 Tip ...
7,378 views
3 years ago
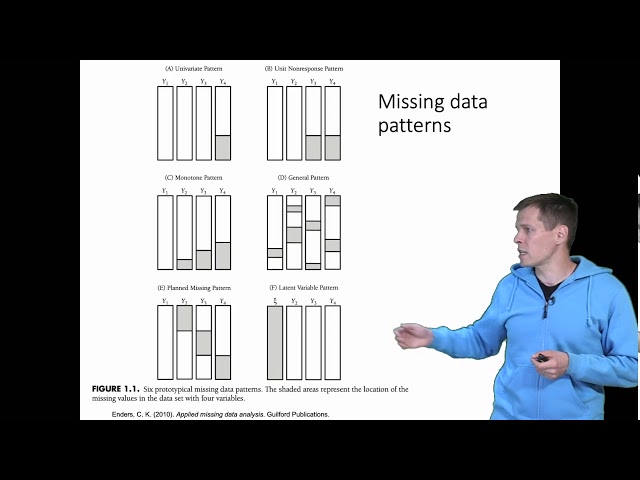
Monotone pattern where the amount of missingness increases over time would be a problem. We along it to the studies where you ...
5,226 views
If you've found any value in my videos, please consider supporting my channel. Your donation, no matter the amount, helps fuel ...
706 views
Learn the fundamental concept every successful trader masters: Risk to Reward Ratio. In this comprehensive guide, discover how ...
28,169 views
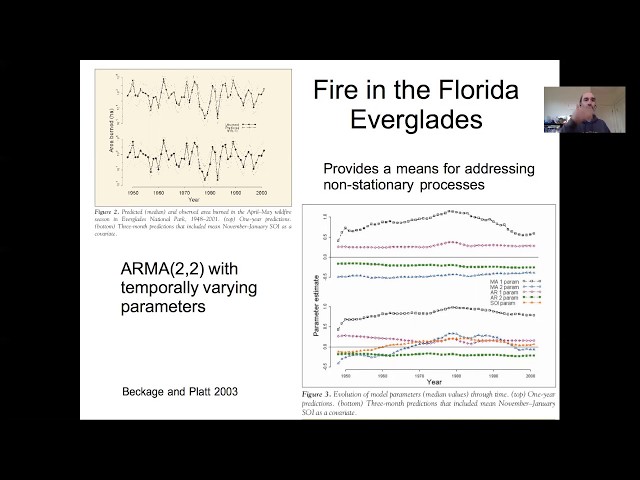
Boston University EE509 "Applied Environmental Statistics" Course: In our fourteenth lecture on time-series models we go over ...
120 views
https://amzn.to/4aLHbLD You're literally one click away from a better setup — grab it now! As an Amazon Associate I earn ...
34 views
In this video, we break down the concept of OFDM (Orthogonal Frequency Division Multiplexing)—a key technology behind Wi-Fi, ...
50,070 views
9 months ago
35 views
Course: https://github.com/rmcelreath/stat_rethinking_2023 Outline 00:00 Introduction 05:18 Missing data in DAGs 19:42 ...
7,520 views
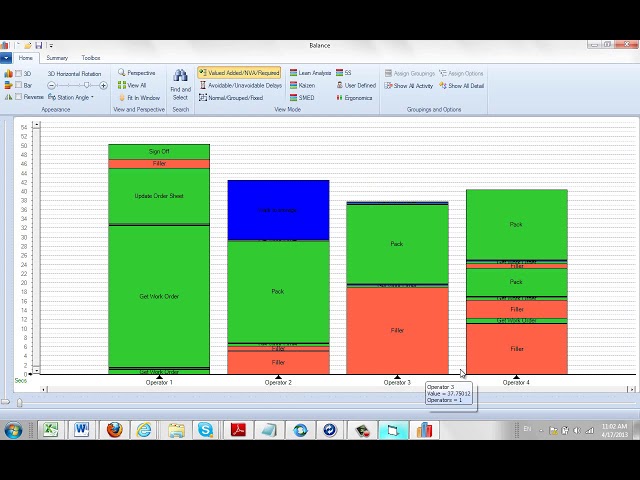
Timer Pro - Summarizing Time and Motion Studies on the PC - Charting Your Time Study Data for Process Redesign ...
210 views
8 years ago
In this video, we're going to look at frequency tables.These numbers are enough to give someone a headache and there's only ...
47,681 views