Upload date
All time
Last hour
Today
This week
This month
This year
Type
All
Video
Channel
Playlist
Movie
Duration
Short (< 4 minutes)
Medium (4-20 minutes)
Long (> 20 minutes)
Sort by
Relevance
Rating
View count
Features
HD
Subtitles/CC
Creative Commons
3D
Live
4K
360°
VR180
HDR
2,306 results
Learn about Chrome Developer Tools. We'll have a detail look at what different options exist for developer to troubleshoot their ...
537 views
3 years ago
Barry joins Jecelyn again to explain how to record a trace in the Performance panel and debug LCP and CLS issues using the ...
32,844 views
1 year ago
Discover 5 different ways to debug your code beyond console.log - Discover the breakpoints, debugger statements, logpoints, ...
44,905 views
2 years ago
If you're still using console.log() to find and fix JavaScript issues, you might be spending more time debugging than you need to.
905,629 views
8 years ago
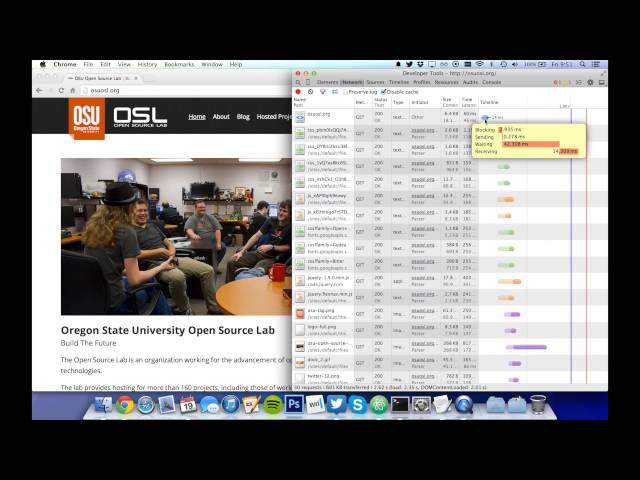
By Oregon State University Open Source Lab Student Sysadmin Jeffrey Borcean.
16,359 views
11 years ago
Join in as we take a deep dive into the Chrome developer tools and learn, among other things, how to: - Quickly test styling fixes ...
506 views
Learn how to use the most popular Chrome DevTools features related to inspecting network activity, including: 1:05 - View a ...
401,144 views
6 years ago
P.S.R. Patnaik Assistant Professor Computer Science and Engineering Walchand Institute of Technology.
879 views
Test UI changes and production fixes with the powerful network response overrides in Chrome DevTools. Learn to override and ...
14,754 views
Chrome & Chromium DevTools can now debug CSS Grids, helping you discover CSS grids on a page, examine them and debug ...
2,070 views
5 years ago
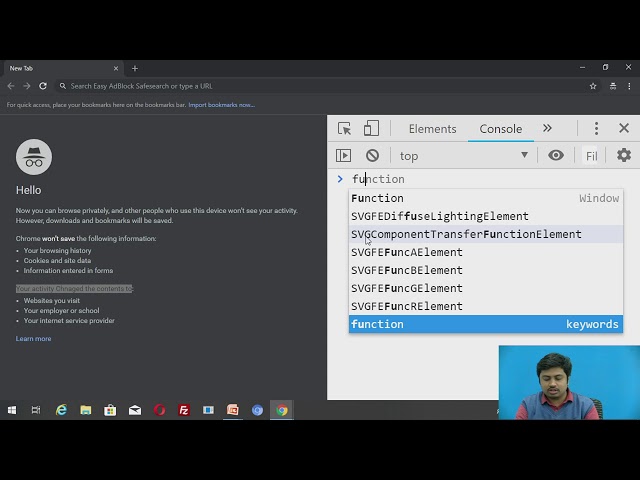
javascript #tutorial #hindi What you can learn from this video: Basic overview of developer tools tab How to debug JavaScript in ...
17 views
Announcing ChromeDevTools MCP! Connect your AI coding agent to Chrome's powerful automation & debugging capabilities ...
14,504 views
5 months ago
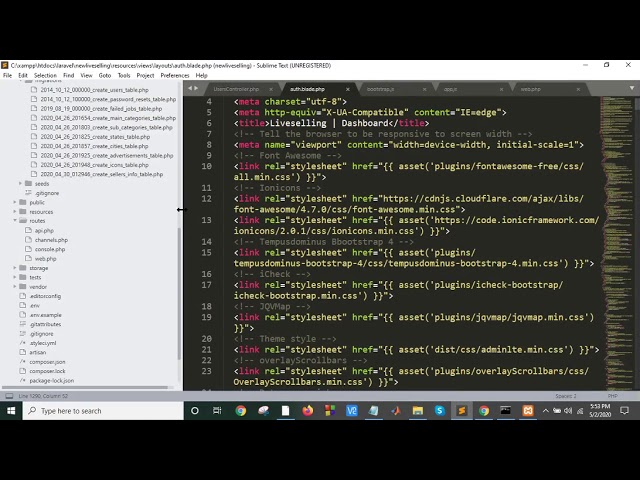
Welcome, How to install React Developer tools. Also, how to use React Developer Tools in Hindi. Error handling in React Js in ...
199,575 views
Have you ever applied CSS to an element but it just doesn't work? In this episode, Jecelyn and Sofia show us how to discover ...
14,216 views
In this episode, Bramus and Jecelyn walk you through the different ways of logging and filtering messages in the Console.
80,821 views
Learn how to debug your web app effectively with Chrome DevTools. Inspect and modify components, create watch expressions ...
41,882 views
Let's take a look at some of the color features in DevTools. Chapters: 0:00 - Introduction 0:13 - Shortcut to change selected color ...
15,431 views
4 years ago
167 views
In this video you'll learn how to view JavaScript errors in the Chrome Dev Tools console.
266 views
12 years ago
Chrome DevTools: a suite of tools to debug and profile the performance of your site. They're bundled with every copy of Chrome, ...
42 views
7 years ago