Upload date
All time
Last hour
Today
This week
This month
This year
Type
All
Video
Channel
Playlist
Movie
Duration
Short (< 4 minutes)
Medium (4-20 minutes)
Long (> 20 minutes)
Sort by
Relevance
Rating
View count
Features
HD
Subtitles/CC
Creative Commons
3D
Live
4K
360°
VR180
HDR
2,530 results
Looking to level up your crypto data analysis? In this video, we dive deep into BTCUSD price trends using MongoDB Time Series ...
63 views
8 months ago
Cryptocurrency investigations - like Bitcoin forensics - usually involve blockchain transaction analysis. You can use ...
17,697 views
4 years ago
Visualization of Cryptocurrency transactions - Bitcoin, Ethereum & Bitcoin Cash. Data taken from TxStreet.com ...
7,541 views
5 years ago
Live example of an iceberg sell order on the ES futures market. Using MBO data Bookmap is able to display hidden iceberg ...
112,338 views
2 years ago
Cryptocurrency investigation is much like other forms of financial crime investigation. Find transactions, find accounts and tie ...
21,637 views
PLAYLIST: Bitcoin, Blockchain, ICOs and Cryptocurrencies ...
31,954 views
8 years ago
Graphical visualisation of the Bitcoin Github repository from 2009 to 2018. The tools used are Gource, Git, ffmpeg and Perl.
71,408 views
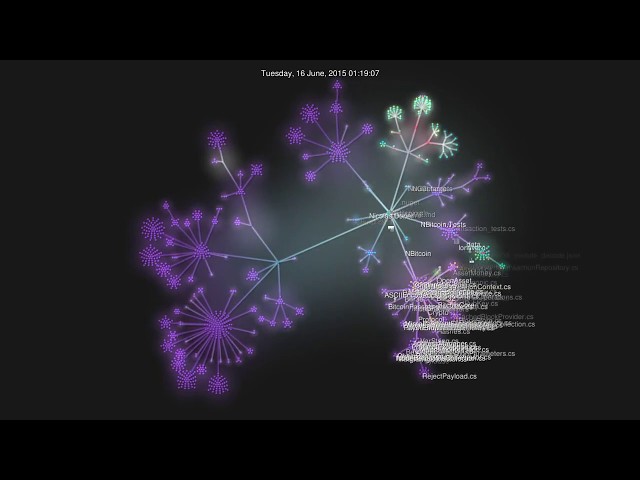
https://github.com/MetacoSA/NBitcoin.
124 views
7 years ago
Our website: https://vz.agency. Our portfolio: https://vimeo.com/1infographics Feel free to write us with your project at ...
3,305 views
6 years ago
Graphical visualisation of all Ethereum Github repositories from 2013 to 2018. The tools used are Gource, Git, ffmpeg and Perl.
20,657 views
Do you want to trade successfully? Download ATAS for free with full functionality: https://web.atas.net/download_atas_en ✓ Also, ...
11,674 views
5 months ago
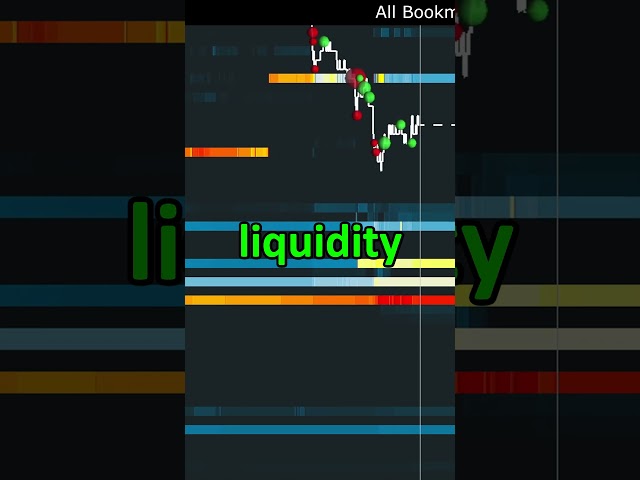
How the Bookmap heatmap is generated and the information it shows. A visualization of the historical liquidity within the order ...
93,692 views
3 years ago
Early version.
505 views
11 years ago
11,406 views
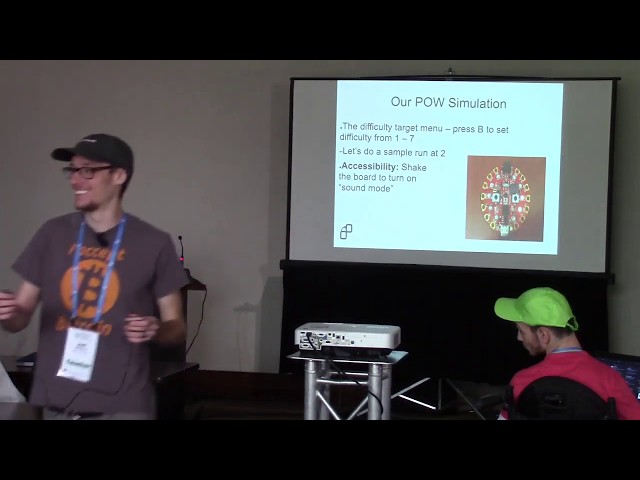
My session at the 2019 Blockchain Training Conference in Aurora, CO. This session breaks down proof of work algorithms with a ...
151 views
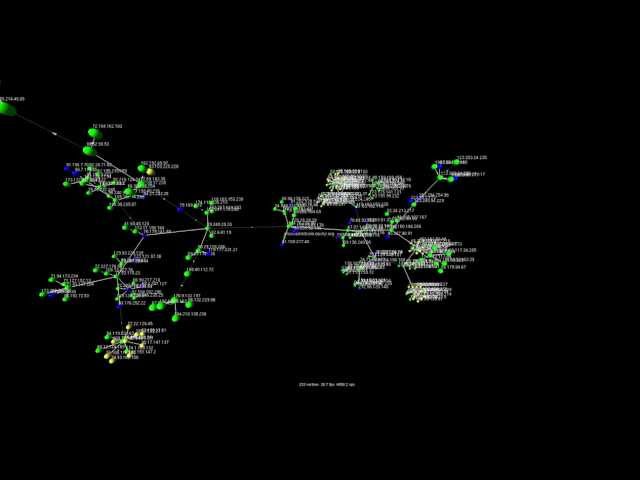
This is a real-time visualization of a node connecting into the Bitcoin P2P network, a living and beautiful network.
5,066 views
12 years ago
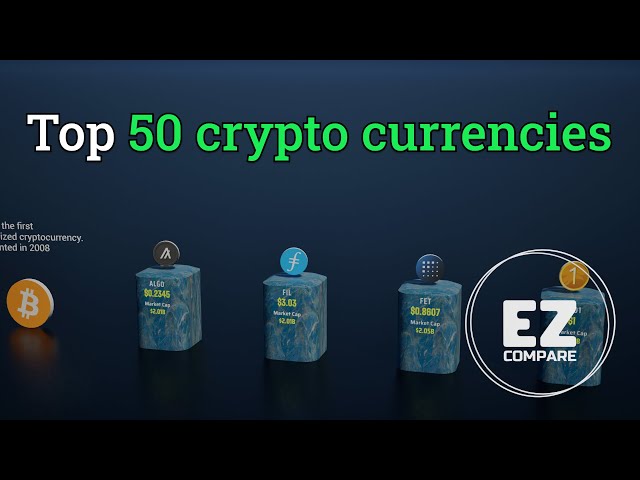
In this video, we break down the top cryptocurrencies of 2025, comparing their prices, market caps, and global popularity.
46 views
Wasabi is an open-source, non-custodial, privacy focused Bitcoin wallet for desktop. It implements trustless coin shuffling: ...
182 views
41,602 views
Passive liquidity can be used to measure the momentum of a move. Try it for yourself - get Bookmap for FREE here: ...
95,727 views


![Personal Finance: Cryptocurrencies & Blockchain, How & Why They Work, Visualize Bitcoin Need [ASMR]](/api/proxy/image?url=https%3A%2F%2Fi.ytimg.com%2Fvi%2Frecv92rwfMQ%2Fsddefault.jpg)