ViewTube

ViewTube
Sign inSign upSubscriptions
Filters

Upload date

Type

Duration

Sort by

Features

Reset

7,022 results

Alex The Analyst
Best Resources to Learn Data Visualization in 2025

In this video we take a look at the best resources to learn Data Visualization in 2025! 25% off Analyst Builder Code: ...

4:28
Best Resources to Learn Data Visualization in 2025

15,834 views

8 months ago

TrentDoesMath
Is this FREE tool better than Power BI? | Apache Superset Overview

Try CodeCrafters for free using my referral link: https://app.codecrafters.io/join?via=trentpark8800 This video gives data ...

1:04:20
Is this FREE tool better than Power BI? | Apache Superset Overview

3,033 views

2 months ago

Riffomonas Project
How to perform a constructive critique of a data visualization (CC374)

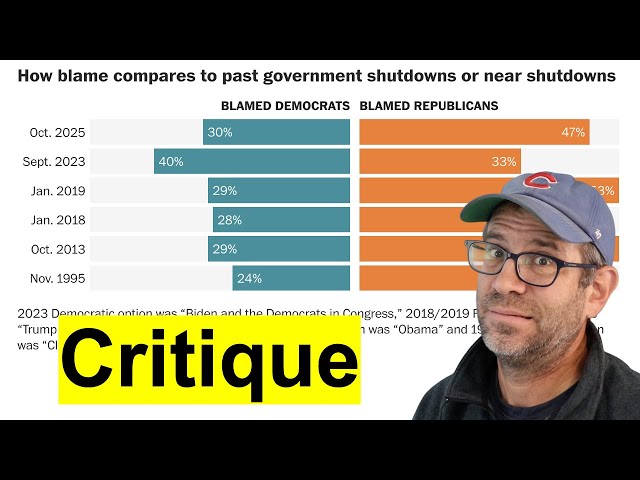
Pat introduces the DAIJ model for giving a critique to a data visualization that is often used to critique art. By describing, analyzing ...

30:24
How to perform a constructive critique of a data visualization (CC374)

671 views

4 months ago

Alex Followell | AI Automation
How To Make Stunning Charts From a CSV in 60 Seconds! (n8n + Datawrapper)

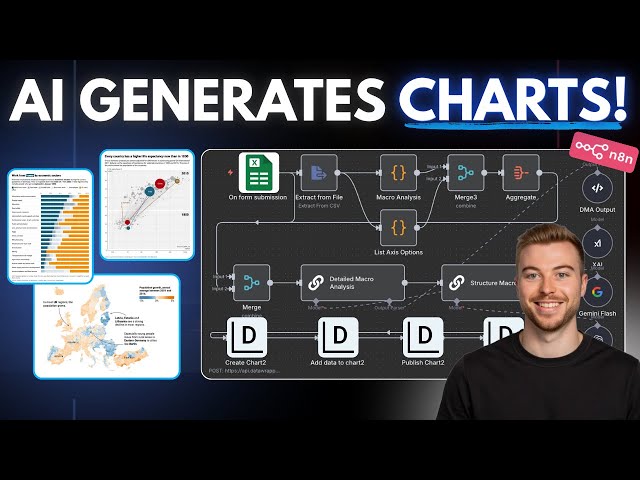
Access AI blueprints, tutorials, tools & expert help to level up fast! https://bit.ly/4lV67U2 Links Mentioned: - ⚡️ n8n: ...

26:27
How To Make Stunning Charts From a CSV in 60 Seconds! (n8n + Datawrapper)

2,302 views

6 months ago

Free Background Design
Neon Line Graph Animation | Stock Market & Business Chart Template | Data Visualization

Neon Line Graph Animation | Stock Market & Business Chart Template | Data Visualization Visualize your data with impact using ...

0:16
Neon Line Graph Animation | Stock Market & Business Chart Template | Data Visualization

48 views

6 months ago

Riffomonas Project
Adding professional polish to your data visualizations (CC398)

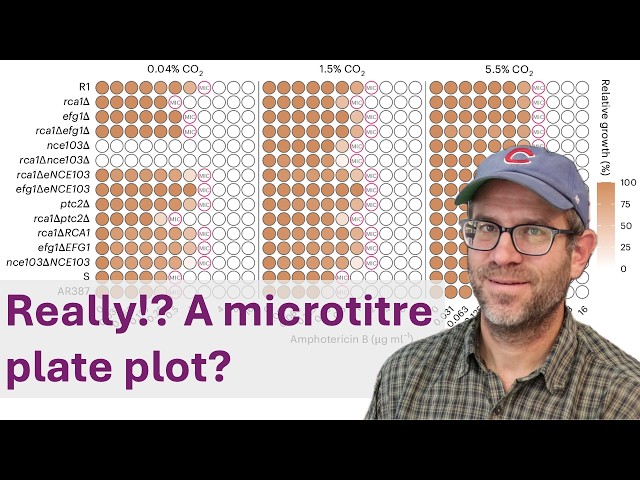
In this livestream, Pat refactors a plot from a paper recently published in Nature Microbiology that had considerable room for ...

1:50:21
Adding professional polish to your data visualizations (CC398)

950 views

Streamed 2 weeks ago

Free Background Design
Animated Business Growth Chart Loop | Data Visualization | Upward Trend Bar Graph 4K

Animated Business Growth Chart Loop | Data Visualization | Upward Trend Bar Graph 4K Looking for professional motion ...

0:10
Animated Business Growth Chart Loop | Data Visualization | Upward Trend Bar Graph 4K

124 views

3 months ago

Bioinformatics DotCa
Introduction to R, Montréal, 2025 | 04: Data Visualization

Canadian Bioinformatics Workshop series: - Introduction to R - Data Visualization (Han Yu) - Day 2, Module 4 Lecture slides and ...

1:15:31
Introduction to R, Montréal, 2025 | 04: Data Visualization

44 views

3 months ago

ITCR Training Network
Data Visualization Basics & Beyond

This is a recording of a talk given by Kate Isaac about best practices for data visualizations, especially for complex data for the ...

1:03:02
Data Visualization Basics & Beyond

5 views

1 month ago

Valerio Viperino
Through the Streets of San Francisco - Car Crashes Data Visualization (2025)

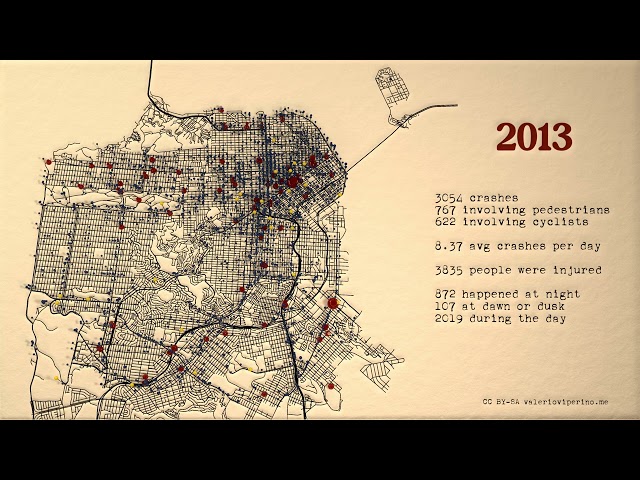
Data visualization in Houdini of 20 years of crashes in SF, using open data provided by https://data.sfgov.org. Main blog post: ...

0:21
Through the Streets of San Francisco - Car Crashes Data Visualization (2025)

16 views

1 month ago

yusakru
AI Agent Converts Messy CSV to Report in 30 Seconds (Minimax Hackathon Project)

#MinimaxAgent #AIHackathon #NoCode #DataAnalysis #BusinessIntelligence #React #DataVisualization #ArtificialIntelligence.

1:10
AI Agent Converts Messy CSV to Report in 30 Seconds (Minimax Hackathon Project)

56 views

6 months ago

Alex Followell | AI Automation
Turn CSVs into Charts & Insights in Seconds! (n8n)

Join the Skool AI Community – blueprints, tutorials, tools & expert help to level up fast! https://bit.ly/454oVuE Links ...

21:34
Turn CSVs into Charts & Insights in Seconds! (n8n)

11,395 views

9 months ago

Riffomonas Project
Imagining a 96 well plate as a data visualization of antibiotic resistance (CC394)

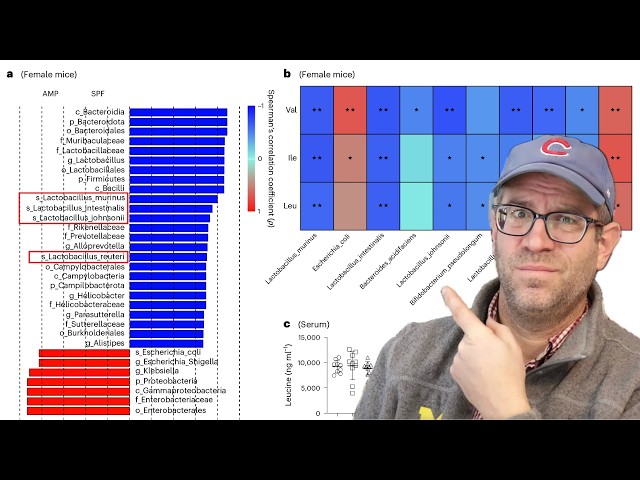
Pat critiques a figure from a paper published in the scientific journal Nature Microbiology that created a unique heatmap that ...

28:46
Imagining a 96 well plate as a data visualization of antibiotic resistance (CC394)

583 views

1 month ago

Data Science Learning Community Videos
Fundamentals of Data Viz: Visualizing trends & Visualizing geospatial data (dataviz01 14 15)

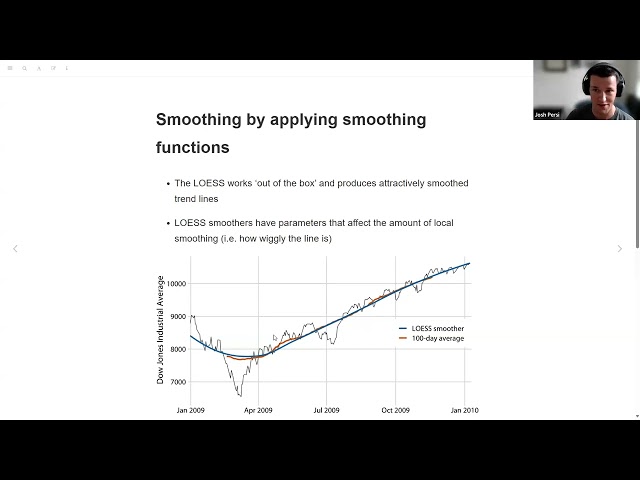
Josh Persi leads a discussion of Chapter 14 ("Visualizing trends") and Chapter 15 ("Visualizing geospatial data") from ...

50:01
Fundamentals of Data Viz: Visualizing trends & Visualizing geospatial data (dataviz01 14 15)

91 views

5 months ago

Blender
SciBlend: Advanced Data Visualization Workflows — Blender Conference 2025

"SciBlend: Advanced Data Visualization Workflows" by José Marín at Blender Conference 2025 Scientific data visualization is ...

18:54
SciBlend: Advanced Data Visualization Workflows — Blender Conference 2025

3,164 views

5 months ago

WordPress
WordCamp US 2025: Jai Ranganathan "Data visualization the easy way"

Creating websites stuffed full of cool data visualizations for an entire government agency usually requires a large technical team ...

23:37
WordCamp US 2025: Jai Ranganathan "Data visualization the easy way"

74 views

5 months ago

Geospatial Centroid
Data Visualization in R

An overview of data visualization techniques in R using the {ggplot2} package.

1:04:40
Data Visualization in R

129 views

5 months ago

Fornelli X Design (FxD)
Version 2 - High-Performance Athlete in Motion – Speed & Data Visualization Art | #videobackground

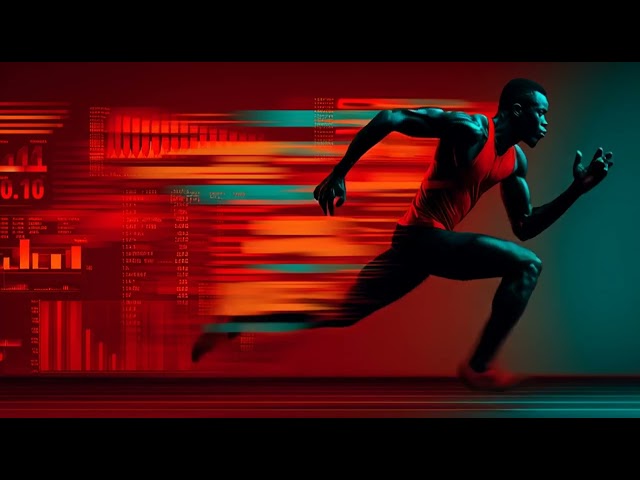
This high-end digital advertisement captures the explosive energy of an elite athlete in full sprint. The subject, named “Darius ...

0:06
Version 2 - High-Performance Athlete in Motion – Speed & Data Visualization Art | #videobackground

6 views

6 months ago

Data Science Learning Community Videos
Fundamentals of Data Visualization: Visualizing uncertainty (dataviz01 16)

Gabby Palomo leads a discussion of Chapter 16 ("Visualizing uncertainty") from Fundamentals of Data Visualization by Claus O.

24:58
Fundamentals of Data Visualization: Visualizing uncertainty (dataviz01 16)

122 views

5 months ago

The Debug Zone
Proportional Color Bar Sizing in StyleColorBar for Data Visualization

In this video, we delve into the innovative features of StyleColorBar, focusing on proportional color bar sizing for enhanced data ...

1:30
Proportional Color Bar Sizing in StyleColorBar for Data Visualization

4 views

11 months ago