Upload date
All time
Last hour
Today
This week
This month
This year
Type
All
Video
Channel
Playlist
Movie
Duration
Short (< 4 minutes)
Medium (4-20 minutes)
Long (> 20 minutes)
Sort by
Relevance
Rating
View count
Features
HD
Subtitles/CC
Creative Commons
3D
Live
4K
360°
VR180
HDR
87,946 results
Excel is one of the most used skills in the data world. In this series we will be walking through all of the most important topics that ...
213,558 views
4 years ago
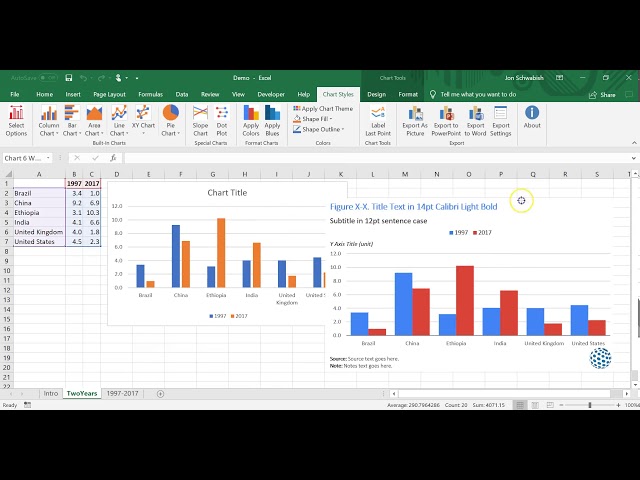
Learn more about how the Excel Chart Styles Add-In from PolicyViz and PeltierTech works.
1,361 views
6 years ago
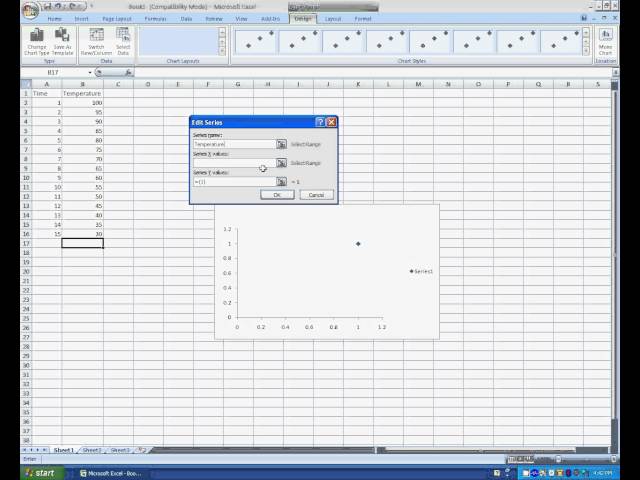
In this Microsoft Excel tutorial you will learn how to add a data series to your chart in Microsoft Excel. About The Trainer: This ...
152,718 views
5 years ago
This tutorial shows you how to make a basic graph in Excel 2007 for you chemistry lab reports. Best viewed in 720 p and ...
3,008 views
14 years ago
Download my FREE 8-page guide "1:1 Mastery for Employees" here https://www.risevale.com/fg1 Complete guide to Pareto ...
178,935 views
In this Excel video tutorial, we learn how to create advanced chat that responds to dropdown list. If you enjoy the video, consider ...
632 views
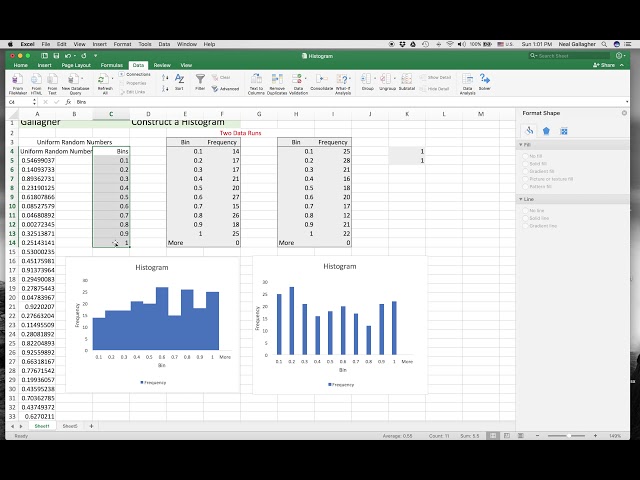
Using the data analysis addon tool in Excel produces a histogram that does not change with new data. If you want your histogram ...
1,980 views
8 years ago
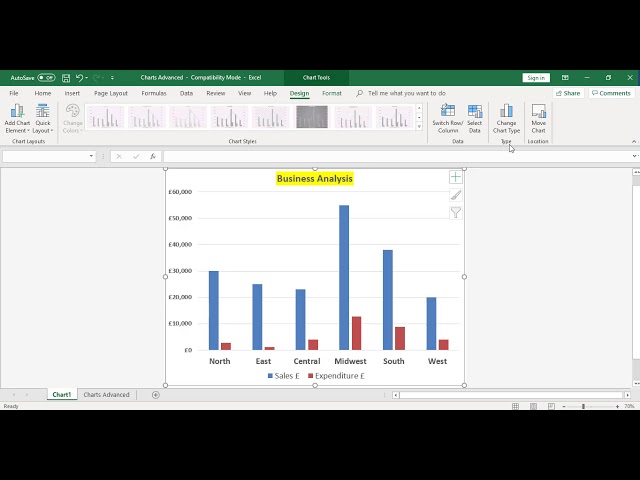
Covering how to use a stacked bar chart to create some more flexible chart options, particularly around error bars, ranges and ...
1,067 views
3 years ago
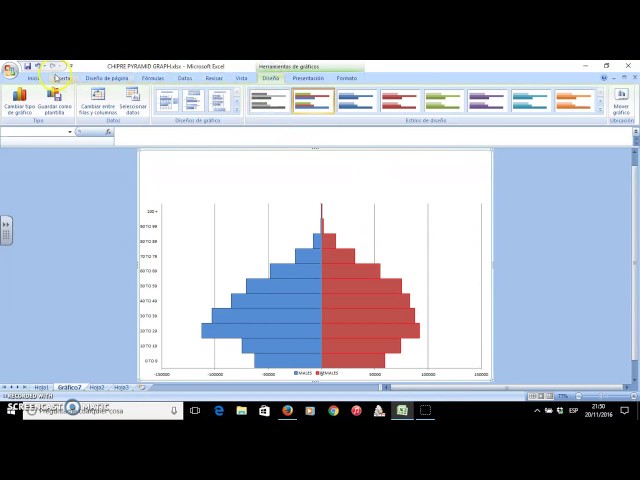
In this video you'll learn how to create a Pyramid Graph using Microsoft Office Excel.
3,587 views
9 years ago
Level up your Graphs in Excel with this step-by-step tutorial. Make your data stand out and tell a story with his unique approach to ...
229 views
39 views
12 years ago
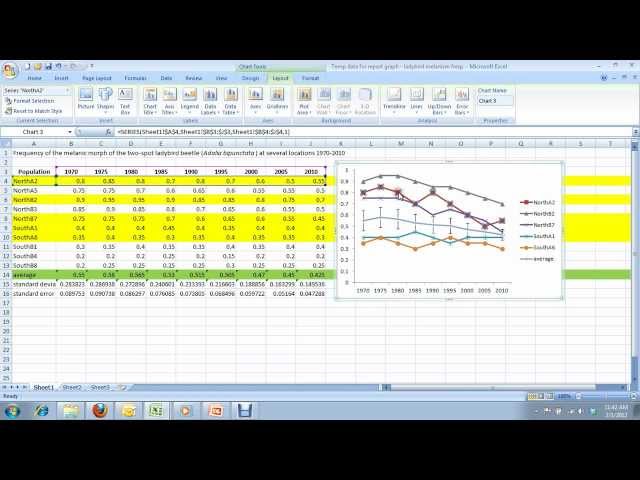
How to create a multi data series line graph in Microsoft Excel 2007/2010. One of several video tutorials created for students in ...
206,407 views
13 years ago
Thanks for Watching! If you enjoy our videos please like, share or subscribe.
141 views
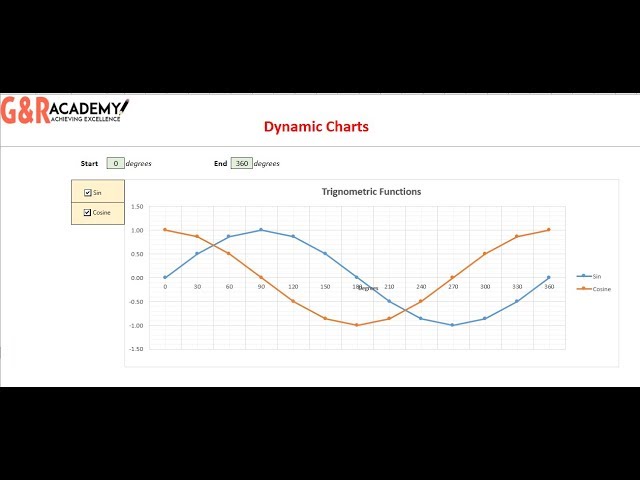
Support Me & More: linktr.ee/benthompsonuk In this tutorial I demonstrate how you can create a dynamic yet easy to implement ...
13,383 views
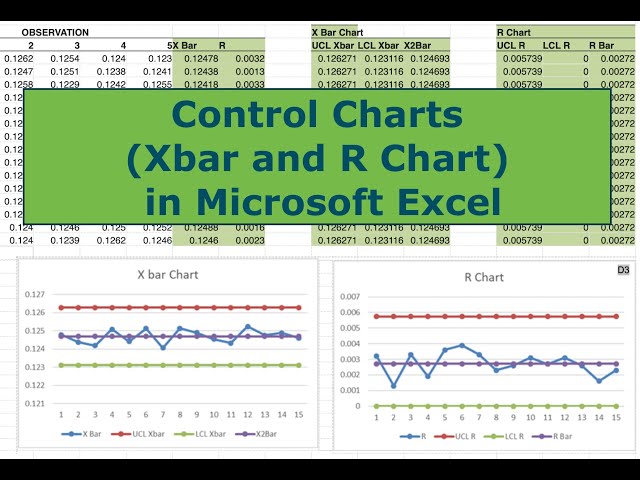
In this video I walk you through all the steps necessary to construct Control Charts (Xbar and R) in Microsoft Excel. Control charts ...
44,119 views
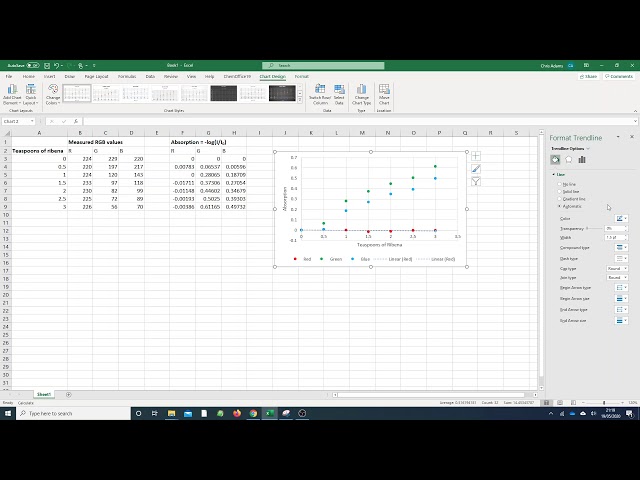
What I'm going to do now is show you how to make a graph of it. What we need to plot is teaspoons of Ribena against the three ...
690 views
How to create a 4 variables chart in excel? Helpful? Please support me on Patreon: https://www.patreon.com/roelvandepaar With ...
634 views
Join members: https://www.youtube.com/channel/UCeX5SphLC0ky7rpbsffFwqg/join In this tutorial we show you how to create a ...
66,023 views
How to add a new data series to an existing Excel chart so that empty cells are not included. You can copy and paste data into an ...
75,398 views
7 years ago
This video tutorial provides 2 ways to make excel charts dynamic: 1. Changing the range of the chart which can help zoom in and ...
1,618 views
In this tutorial you can learn How To Draw A Graph In Excel. Please subscribe my channel and keep in touch... Thanks.
2,228 views
Excel chart doesn't show 'value' on hover Helpful? Please support me on Patreon: https://www.patreon.com/roelvandepaar With ...
208 views
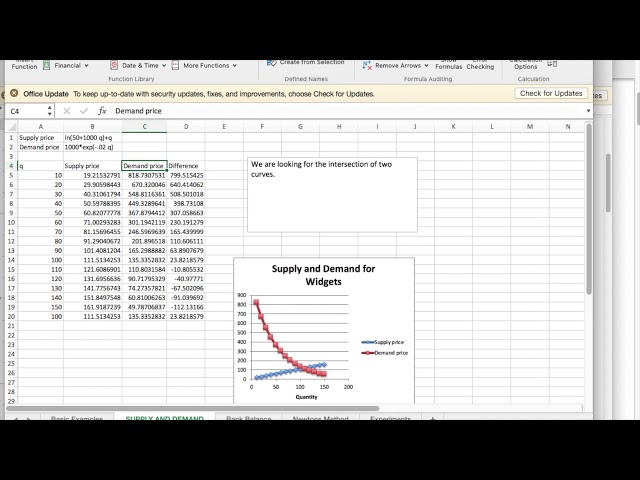
Using Goal Seek to find the intersection point of two curves.
35,395 views
You cannot natively add conditional formatting to chart objects in Excel. Maybe someone can bug them about that. Until then, this ...
3,297 views
2 years ago
242 views
10 years ago


![Dynamic Advanced Chart with Data Validation [Excel File link]](/api/proxy/image?url=https%3A%2F%2Fi.ytimg.com%2Fvi%2F0bBAmdd9YiA%2Fsddefault.jpg)