Upload date
All time
Last hour
Today
This week
This month
This year
Type
All
Video
Channel
Playlist
Movie
Duration
Short (< 4 minutes)
Medium (4-20 minutes)
Long (> 20 minutes)
Sort by
Relevance
Rating
View count
Features
HD
Subtitles/CC
Creative Commons
3D
Live
4K
360°
VR180
HDR
757 results
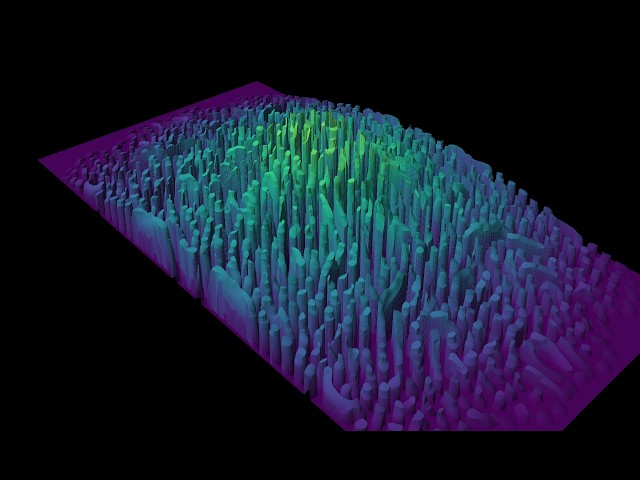
This is a new visualization of the video https://youtu.be/lgrSjKU8iHo of the Gray-Scott model, that was suggested in a comment.
285 views
6 days ago
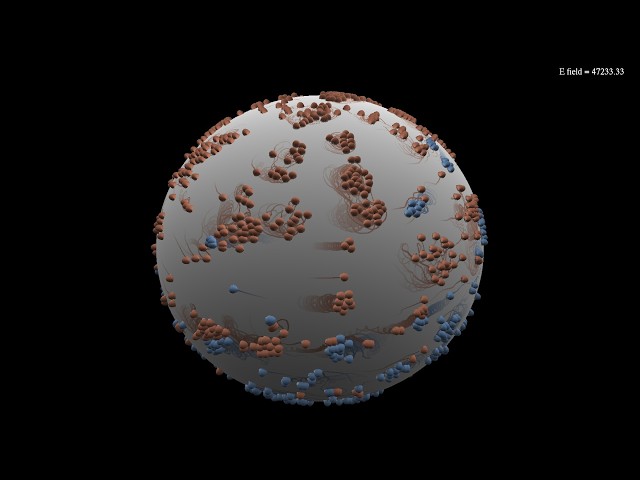
This is a variant of the simulation https://youtu.be/GCAgtXPEbXA , showing hypothetical particles on the sphere that could be ...
1,050 views
5 days ago
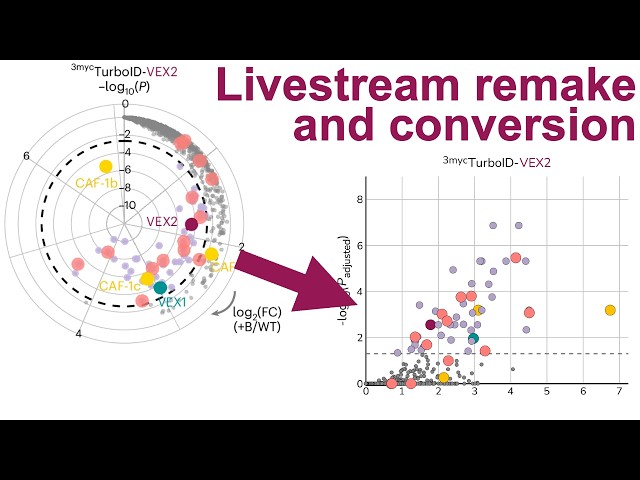
Pat carries out a constructive critique of a radial volcano plot that was recently published in Nature Microbiology. Although visually ...
777 views
4 days ago
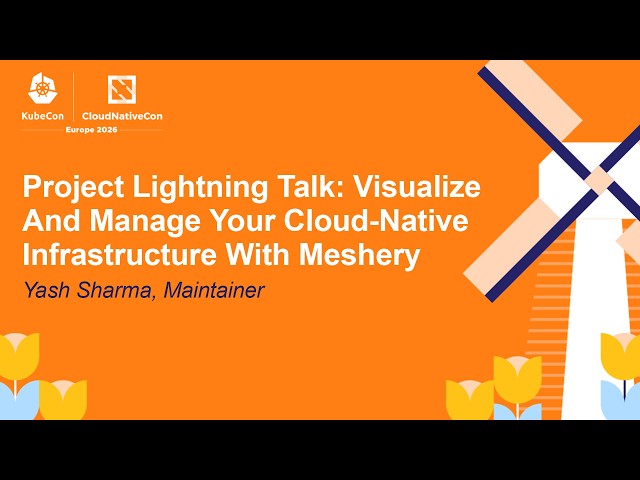
Don't miss out! Join us at our next KubeCon + CloudNativeCon events in Mumbai, India (18-19 June, 2026), Yokohama, Japan ...
33 views
1 day ago
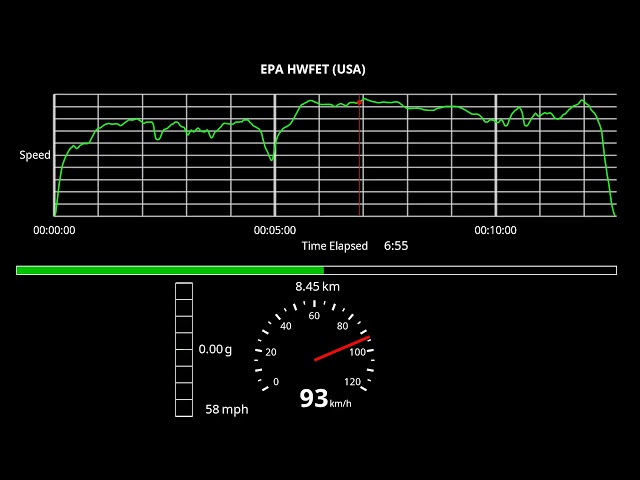
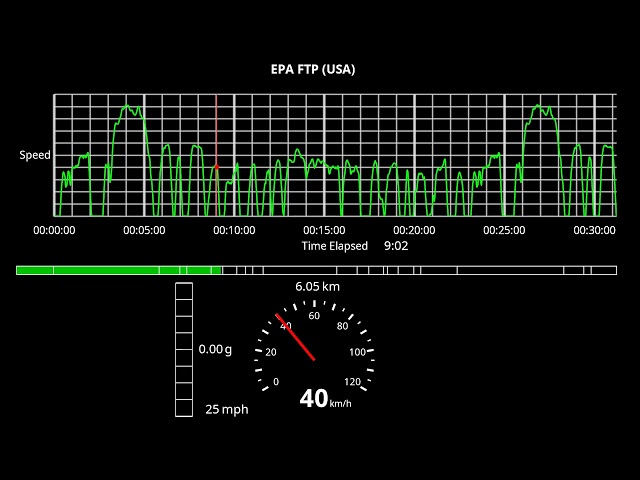
This cycle is totally out of date long ago and does not accurately represent highway driving conditions due to low speeds - very ...
1 view
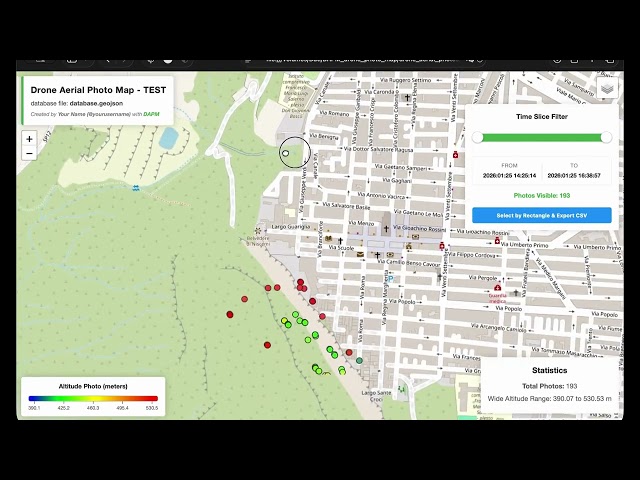
Visualizing Your Drone Missions: Introducing DAPM, the Drone Aerial Photo Mapper If you are a drone pilot or a GIS enthusiast, ...
10 views
This is a "city" test cycle which in fact includes some urban highway runs This is one of the 2 required cycles for fuel economy ...
2 views
This is the Visualization practice — one of four meditation techniques used in Positive Thinking Conscious Thinking, a 21-day ...
0 views
3 days ago
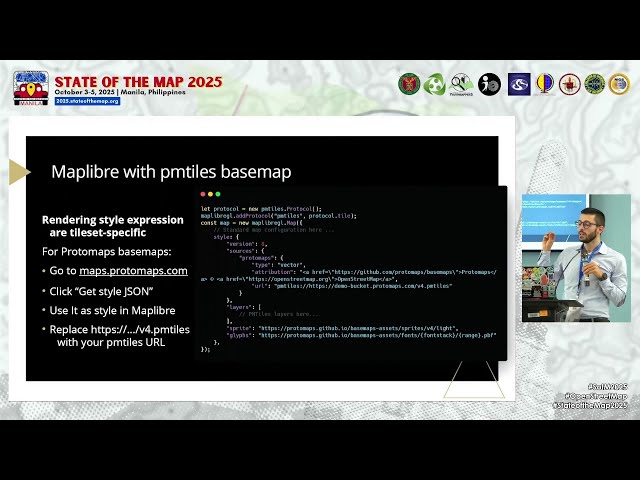
https://media.ccc.de/v/sotm2025-71664-why-and-how-to-visualize-osm-data-using-pmtiles In this talk I will describe the pros and ...
8 views
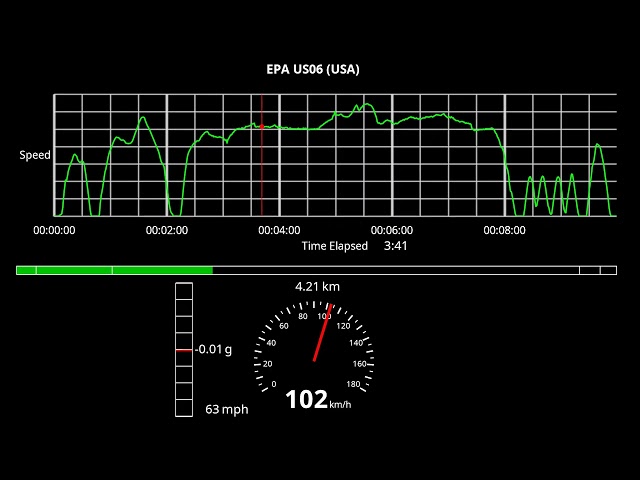
This cycle has higher power demand and sustained speeds for measuring vehicle emissions Also optionally used for fuel ...
official visualizer for BIG DEAL (live) by Trash Panda Go Kart track 2 from the LIVE RACCOONS INSIDE lp listen & download: ...
7 days ago
This cycle is conducted with ambient temperature of 35°C for testing emissions caused by high air conditioning loads.
7 views
Floral Formula Engine – Create 2D & 3D Floral Diagrams from Floral Formulas! In this video, I built a standalone HTML mini ...
16 views
official visualizer for TUMBLING RACCOON by Trash Panda Go Kart track 6 from the LIVE RACCOONS INSIDE lp listen ...
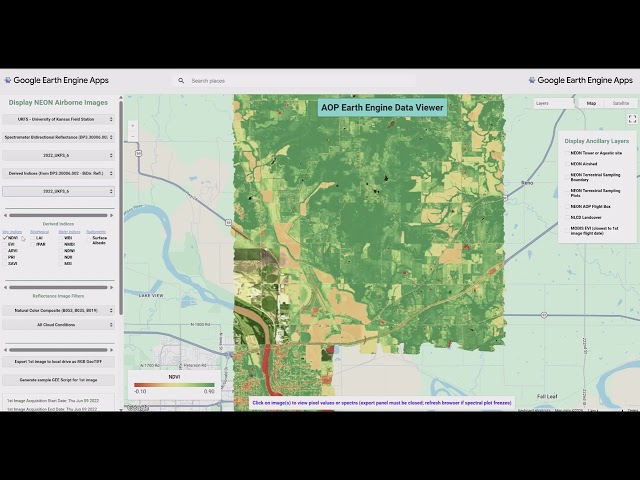
Welcome to the official video demonstrating key features of the NEON AOP Google Earth Engine (GEE) Data Viewer. This tool is ...
32 views
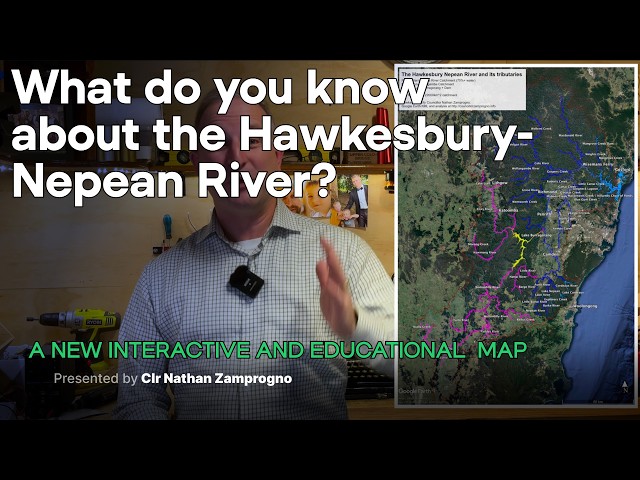
There are times when my teaching and being a Councillor overlap in a joyful way. Recently I've been teaching my HSC computing ...
187 views
Music by : TSUKI - The End of Del Monte.
I want to make a sorting Visualizer, the sort works but visualizer doesnot Helpful? Please use the *Thanks* button above! Or, thank ...
15 views
In this livestream, Pat recreates and then refactors a radial volcano plot from a paper published in the journal Nature Microbiology.
561 views
Streamed 2 days ago