ViewTube

ViewTube
Sign inSign upSubscriptions
Filters

Upload date

Type

Duration

Sort by

Features

Reset

3,300 results

Tech With Tim
Learn Matplotlib in 30 Minutes - Python Matplotlib Tutorial

To learn for free on Brilliant, go to https://brilliant.org/techwithtim . Brilliant's also given our viewers 20% off an annual Premium ...

30:51
Learn Matplotlib in 30 Minutes - Python Matplotlib Tutorial

7,462 views

11 days ago

marimo
matplotlib, made interactive.

Our favourite plotting library may just be matplotlib again now that we made it interactive with a puck! It may sounds strange at first, ...

12:08
matplotlib, made interactive.

6,314 views

7 days ago

Maven Analytics
Learn Python: Create Simple & Clear Data Visualizations with Matplotlib

Visualizing data helps you understand it faster, and Matplotlib is one of the best Python tools for making charts. In this video, Lead ...

9:43
Learn Python: Create Simple & Clear Data Visualizations with Matplotlib

211 views

4 hours ago

Rishabh Mishra
Matplotlib Python Tutorial for Beginners | Data Visualization in Python

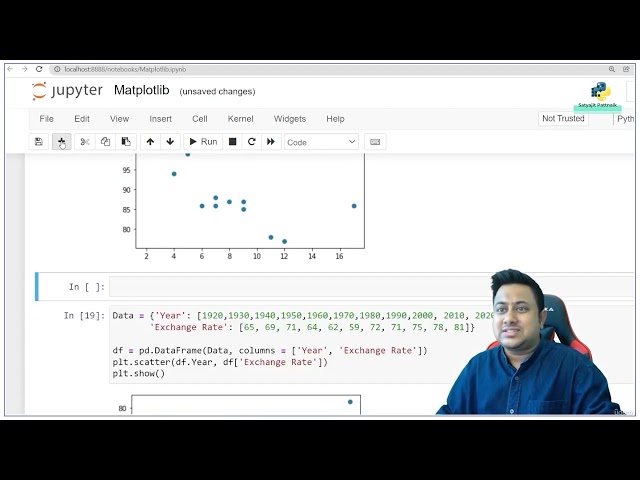
Matplotlib Python Tutorial for Beginners | Data Visualization in Python Matplotlib is a python library used for data ...

39:20
Matplotlib Python Tutorial for Beginners | Data Visualization in Python

5,927 views

7 days ago

NeuralNine
Seaborn Crash Course - Data Visualization in Python

This video today is a crash course on Seaborn, a data visualization library for Python built on top of Matplotlib. It makes it super ...

35:56
Seaborn Crash Course - Data Visualization in Python

5,981 views

3 weeks ago

Yellow Sunflower
Fonts in matplotlib made ridiculously simple with pyfonts

Become a data visualization expert with a 30% discount: https://www.matplotlib-journey.com/ Pyfonts is a Python package that ...

2:20
Fonts in matplotlib made ridiculously simple with pyfonts

136 views

2 weeks ago

Hadoop & Cloud Academy
Data Analysis Numpy Matplotlib

Learn Python NumPy and Matplotlib libraries from scratch in this complete beginner-friendly tutorial. In this video, we explain how ...

1:09:14
Data Analysis Numpy Matplotlib

23 views

3 weeks ago

PyPlus
How to Create a Stacked Area Plot Using Python | Matplotlib Visualization

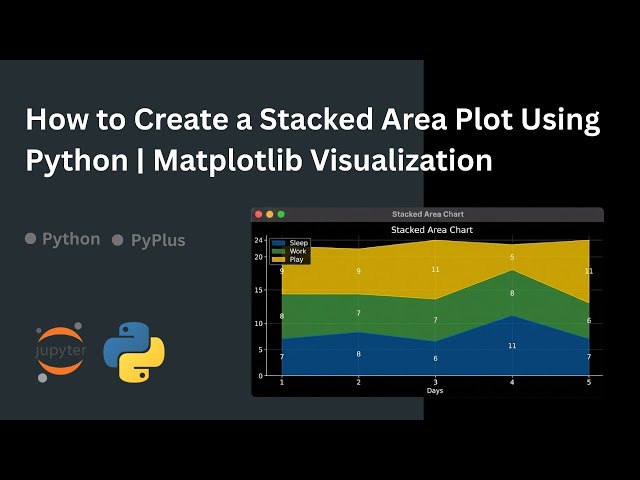
What is a stacked area plot and how can you create one using Python? In this video, you'll learn how to visualize multiple ...

1:37
How to Create a Stacked Area Plot Using Python | Matplotlib Visualization

0 views

8 days ago

Arprax Academy
How to Analyze API Data in Python: Requests, Pandas & Matplotlib Tutorial

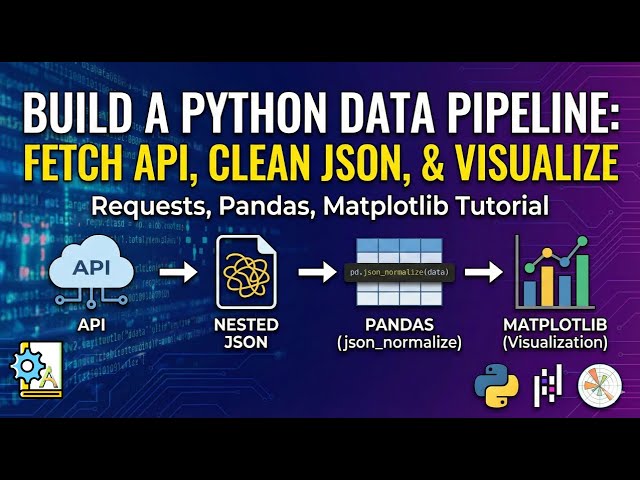
In this video, we build a complete end-to-end data pipeline using Python. You will learn how to fetch real data from an API, handle ...

9:07
How to Analyze API Data in Python: Requests, Pandas & Matplotlib Tutorial

22 views

4 weeks ago

The Debug Zone
Updating z data on a surface_plot in Matplotlib animation

Today's Topic: Updating z data on a surface_plot in Matplotlib animation Thanks for taking the time to learn more. In this video I'll ...

1:32
Updating z data on a surface_plot in Matplotlib animation

0 views

12 days ago

PyPlus
How Do You Create a Polar Plot in Python Using Matplotlib?

In this video, you'll learn how to create a polar plot in Python using Matplotlib and NumPy. Polar plots are useful for visualizing ...

1:20
How Do You Create a Polar Plot in Python Using Matplotlib?

3 views

3 weeks ago

Anahata Intelligence
Scatter plot using matplotlib python library
10:15
Scatter plot using matplotlib python library

2 views

9 days ago

PyPlus
How to Visualize Circular Wave Superposition Using Python | Matplotlib & NumPy

What happens when circular waves overlap? In this video, you'll see how to visualize circular wave superposition using Python ...

2:03
How to Visualize Circular Wave Superposition Using Python | Matplotlib & NumPy

0 views

2 weeks ago

PyPlus
How to Draw the Google Logo Using Python | Matplotlib Text Art

What if you could draw the Google logo using Python? In this video, you'll learn how to create a colorful Google-style text ...

4:13
How to Draw the Google Logo Using Python | Matplotlib Text Art

0 views

6 days ago

Anahata Intelligence
Boxplot & scatterplot in Python libraries using matplotlib
14:59
Boxplot & scatterplot in Python libraries using matplotlib

1 view

9 days ago

Useful Videos
24 Matplotlib
26:38
24 Matplotlib

0 views

10 days ago

Ash2Tutorial
1 Python for ML - NumPy, Pandas, Matplotlib

Python code file: ...

16:25
1 Python for ML - NumPy, Pandas, Matplotlib

161 views

3 weeks ago

The Debug Zone
Matplotlib's autoscale doesn't seem to work on y axis for small values?

Today's Topic: Matplotlib's autoscale doesn't seem to work on y axis for small values? Thanks for taking the time to learn more.

1:22
Matplotlib's autoscale doesn't seem to work on y axis for small values?

1 view

4 days ago

Anahata Intelligence
Matplotlib python library
13:40
Matplotlib python library

4 views

9 days ago

AI NEXUS
“Matplotlib in 60 Seconds 🔥 Visualize Data Like a Data Scientist"

Day 18 of my AI/Data Science journey Today I learned Matplotlib, the foundation of data visualization. In just 60 seconds, you'll ...

0:51
“Matplotlib in 60 Seconds 🔥 Visualize Data Like a Data Scientist"

2 views

2 weeks ago