ViewTube

ViewTube
Sign inSign upSubscriptions
Filters

Upload date

Type

Duration

Sort by

Features

Reset

179 results

OpenStreetMap US
Speedwalk: More Consistent Sidewalk Tagging ~ Dustin Carlino

Speedwalk is a new editor to assess how consistently sidewalks are mapped on roads or as separate ways. This talk will ...

5:59
Speedwalk: More Consistent Sidewalk Tagging ~ Dustin Carlino

22 views

6 days ago

Helsinki Haskell
Data Analysis And Visualization In Clojure Using Noj - Pekka Kaitaniemi - Helsinki Clojure Meetup

Data Analysis And Visualization In Clojure Using Noj by Pekka Kaitaniemi in our first joint functional programming meetup of 2026 ...

47:18
Data Analysis And Visualization In Clojure Using Noj - Pekka Kaitaniemi - Helsinki Clojure Meetup

15 views

5 days ago

UofU Data Science
UofU Foundations of Data Analysis | Spring 2026 | L9: LA Review:  norms, Lin Indenpdence

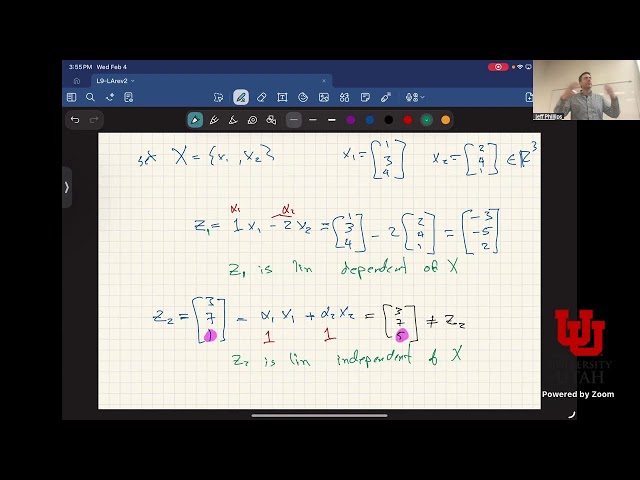
Linear Algebra Review pt2: Norm of vectors (2-norm, p-norm, 1-norm), and matrices (Frobenius, spectral). Linear Independence: ...

59:28
UofU Foundations of Data Analysis | Spring 2026 | L9: LA Review: norms, Lin Indenpdence

32 views

Streamed 7 days ago

Christian Hur
Data - The Hidden AI Killer

Ultimately, the source emphasizes that thorough data analysis prevents project failures and supports the creation of more ...

6:57
Data - The Hidden AI Killer

11 views

6 days ago

ICTP Condensed Matter and Statistical Physics
Hands-on at the XAFS/XRF beamline at SESAME

Speaker: Messaoud Harfouche (SESAME, Jordan) School on Synchrotron Light Sources and Their Applications | (smr 4205)

59:27
Hands-on at the XAFS/XRF beamline at SESAME

14 views

7 days ago

GENIO MIND
CORREL Function in Excel | Calculate Correlation & Analyze Relationships

CORREL Function in Excel helps you calculate correlation and measure the strength and direction of the relationship between ...

0:59
CORREL Function in Excel | Calculate Correlation & Analyze Relationships

5 views

1 day ago

WordLift
Agentic SEO: How to Analyze Google Core Updates with Agent WordLift

Stop guessing why your rankings shifted. In a world where we optimize for both humans and AI, you need dynamic ...

1:18
Agentic SEO: How to Analyze Google Core Updates with Agent WordLift

0 views

6 days ago

OpenAIRE_eu
Hands-on Exercise: Data Cleaning & Preparation with OpenRefine

Trainer: Daniel Garijo, Distinguished Researcher, Universidad Politécnica de Madrid FAIR RDM Bootcamp | Day 3 – Session 3 ...

47:32
Hands-on Exercise: Data Cleaning & Preparation with OpenRefine

0 views

6 days ago

Global Initiative of Academic Networks - GIAN
L01 Data Sources for Hydrological Extreme studies

... otherwise you may miss in the analysis data is problem that is different the analysis problem is nobody will help you like nobody ...

37:16
L01 Data Sources for Hydrological Extreme studies

0 views

7 days ago

CNCF [Cloud Native Computing Foundation]
Deep Dive Into Observability With OpenTelemetry: A Hands-On Codelab - Rishesh Agarwal, Google

Don't miss out! Join us at our next Flagship Conference: KubeCon + CloudNativeCon events in Amsterdam, The Netherlands ...

9:52
Deep Dive Into Observability With OpenTelemetry: A Hands-On Codelab - Rishesh Agarwal, Google

94 views

7 days ago

Analytics Benchmark
Data Analysis training in hyderbad | demo| Analytics Benchmark | 8374015055

Ready to build a career in Data Analytics? Join our Free Data Analytics Demo Session and learn how tools like Power BI, Excel, ...

50:15
Data Analysis training in hyderbad | demo| Analytics Benchmark | 8374015055

145 views

7 days ago

AnalytiCode
These Two Sensors Should Agree… But They Don’t

Two identical BME280 temperature sensors should agree — but they don't. In this video, I show how to calibrate one sensor to ...

3:24
These Two Sensors Should Agree… But They Don’t

72 views

2 days ago

Milos Gregor
Bystander Effect in Data

In data analytics and Business Intelligence (BI), this bias often appears in responsibility for decisions, data quality, or interpretation ...

4:53
Bystander Effect in Data

0 views

7 days ago

Analytics Advisors
81. Excel Area Chart Tutorial | Create Stunning Dashboards Fast 🚀

My Microsoft Excel Playlist: https://www.youtube.com/playlist?list=PLHrw3fxxgFBRyH308kfvRZnAIevkaKkf0 Want your Excel ...

4:29
81. Excel Area Chart Tutorial | Create Stunning Dashboards Fast 🚀

3,177 views

1 day ago

Christian Hur
Numerical Foundations of Computer Vision and Image Analysis

Overview This video serves as an introductory guide to the mathematical foundations essential for understanding computer vision ...

7:38
Numerical Foundations of Computer Vision and Image Analysis

6 views

6 days ago

Vuk Rosić
20 Year-Old TOP 0.1% AI Researcher Explains His Paper

Become AI Researcher - https://www.skool.com/become-ai-researcher-2669/about --- Jiaxuan Zou ...

7:33
20 Year-Old TOP 0.1% AI Researcher Explains His Paper

2,560 views

6 days ago

R Consortium
R Consortium Webinar - Scaling up data analysis in R with Arrow

Historically, scaling up data analysis in R meant adding infrastructure or radically changing analysis strategy - maintaining a ...

59:05
R Consortium Webinar - Scaling up data analysis in R with Arrow

150 views

1 day ago

OpenStreetMap US
OpenStreetMap Driven Broadband Feasibility Modeling with HexMAPP ~ Catherine Crook

HexMAPP uses OpenStreetMap and other open data to model broadband feasibility across the United States. OSM roads and ...

9:43
OpenStreetMap Driven Broadband Feasibility Modeling with HexMAPP ~ Catherine Crook

18 views

6 days ago

EMELISWAP ICT
Introduction (Overview) of Systems Analysis in Systems Analysis and Design Course

This video is part 14 of a 53 part series of tutorials in Systems Analysis and Design Course, and it is also part 1 of 7 in the topic ...

24:16
Introduction (Overview) of Systems Analysis in Systems Analysis and Design Course

28 views

6 days ago

Analytics Advisors
80. Stop Using Regular Line Charts ❌ Use 100% Stacked Line Charts Instead!

My Microsoft Excel Playlist: https://www.youtube.com/playlist?list=PLHrw3fxxgFBRyH308kfvRZnAIevkaKkf0 Regular line charts ...

3:01
80. Stop Using Regular Line Charts ❌ Use 100% Stacked Line Charts Instead!

8,005 views

3 days ago

BioniChaos
Biomedical Data Tools & Open Source & Live Web Development with AI Agents

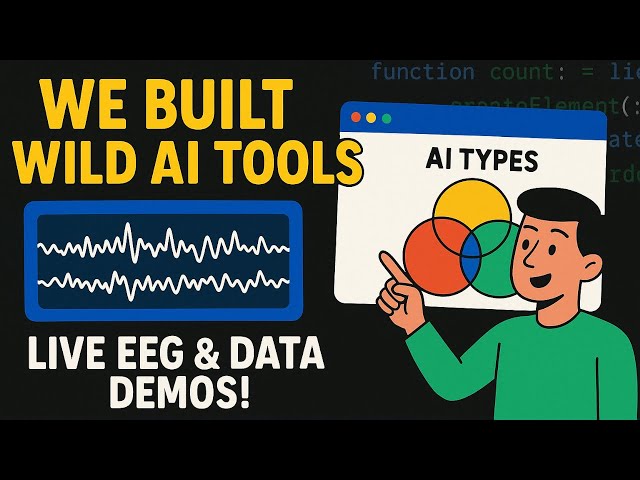
Join us live as we dive into an interactive development session for the BioniChaos website tools. We're eager to hear your ...

1:20:54
Biomedical Data Tools & Open Source & Live Web Development with AI Agents

16 views

Streamed 6 days ago

Statistics UVa
Pie charts and bar charts with RCommander
4:51
Pie charts and bar charts with RCommander

4 views

6 days ago

OpenAIRE_eu
Following the Data: From Repository to Graph – How Open Infrastructures Interconnect Published Data

Format: Demo & walkthrough of data propagation Speaker: Giulia Malaguarnera, Outreach & Engagement Officer, OpenAIRE ...

1:05:50
Following the Data: From Repository to Graph – How Open Infrastructures Interconnect Published Data

0 views

6 days ago

Global Initiative of Academic Networks - GIAN
T03 Geospatial processing for analysis and visualization of floods

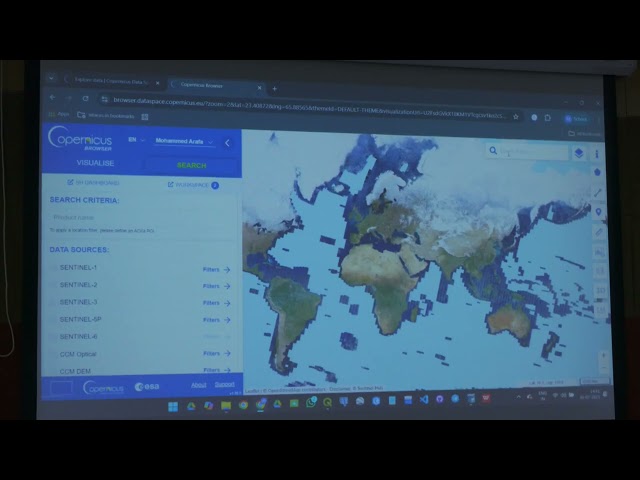
... exact data that is required for analysis purpose so that data we will analyze using QGIS qgis is quantum geographic information ...

2:09:22
T03 Geospatial processing for analysis and visualization of floods

0 views

7 days ago

BioniChaos
Real-Time Face-API.js AI: Age Estimation & Smoothing Techniques with BioniChaos FaceExpress

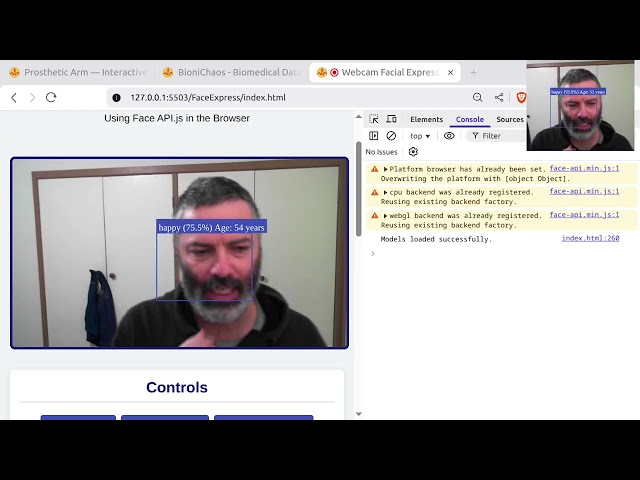
Ever wondered why AI sometimes guesses your age incorrectly? In this video, we explore the mechanics of real-time facial ...

2:10
Real-Time Face-API.js AI: Age Estimation & Smoothing Techniques with BioniChaos FaceExpress

13 views

5 days ago