Upload date
All time
Last hour
Today
This week
This month
This year
Type
All
Video
Channel
Playlist
Movie
Duration
Short (< 4 minutes)
Medium (4-20 minutes)
Long (> 20 minutes)
Sort by
Relevance
Rating
View count
Features
HD
Subtitles/CC
Creative Commons
3D
Live
4K
360°
VR180
HDR
165,020 results
Every day we perceive many visual impressions. We can differentiate a multitude of colors in a bunch of flowers, and we can ...
204,512 views
9 years ago
Take my Full Power BI Course Here: https://www.analystbuilder.com/courses/microsoft-power-bi-desktop-for-business-intelligence ...
212,107 views
3 years ago
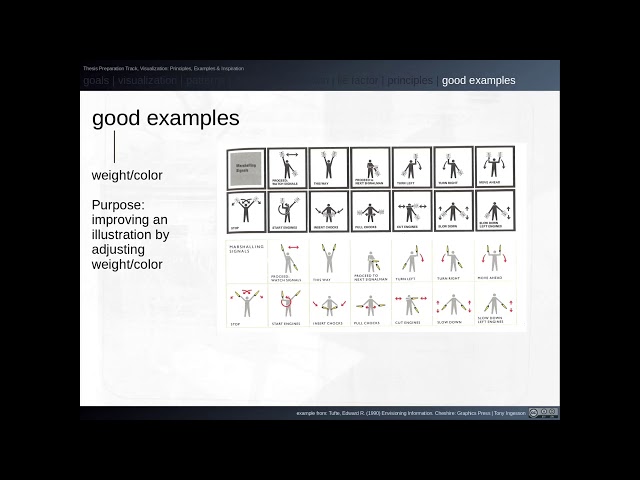
A two-part short lecture on visualization of data: basic visual design principles, bad examples and what Edward Tufte calls "the lie ...
345 views
5 years ago
Presented by David Christensen. This video is part of a series of lectures recorded to teach about basic data visualization ...
156 views
4 years ago
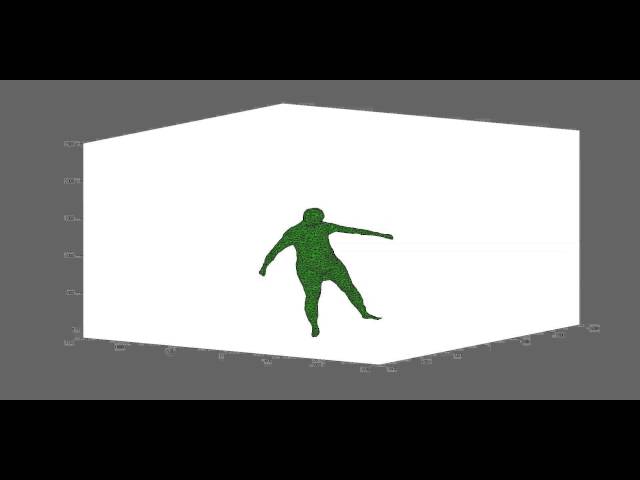
Human motion capture results from the Human Eva II data set using search space decomposition technique (to be sent to ICCV ...
219 views
13 years ago
Things aren't always what they seem! Things are not always as they seem! thangaraj tales, discovery, friendship, love and fate ...
1 view
7 months ago
Crowd Gathers Outside the Stock Exchange after the 1929 Crash Unemployed People Gathering Outside City Hall in Cleveland, ...
55 views
2 years ago
This technique unpivots Microsoft Forms data in Power Query to combine responses into a single column in Power BI. This lets us ...
28,500 views
1 year ago
224 views
We are sorry for the late upload,there are some connection problem yesterday that make us late to upload, please enjoy This ...
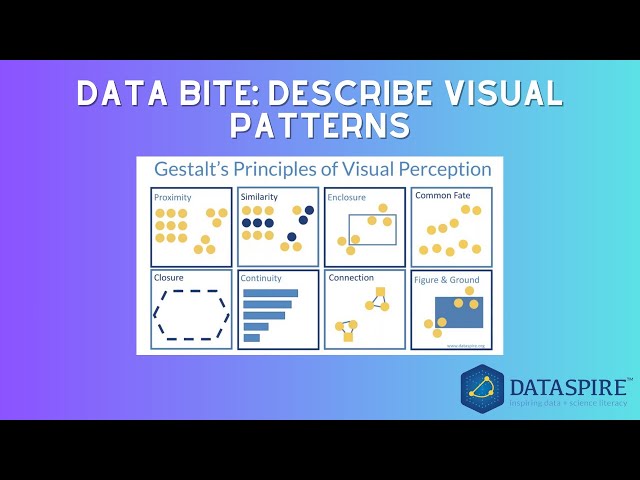
How can we help learners get better at describing visual patterns in data? Here we explore five common data patterns to help ...
74 views
CMU Database Group - Vaccination Database Tech Talks - Booster (2022) Speakers: Vishakha Gupta (ApertureDB) March 7, ...
1,403 views
The power of well-designed data visualizations is often greater than the sum of its parts. Here we unpack some fundamental ideas ...
582 views
Recordings from the University of San Francisco's Spring 2016 MSAN 622 course: Introduction to Data and Information ...
426 views
107 views
Barry J Richmond, NIMH/NIH/DHHS, Bethesda, USA INCF Short Course "Introduction to Neuroinformatics", September 2012.
957 views
12 years ago
NYC Open Data Week 2022 - Mar 12 2022 Have you ever felt trapped by only having a few chart types to choose from in your ...
67 views
I'm very excited to welcome our next team talk uh from the amazing bloomberg visual data team i'm so excited to have him here ...
656 views
11 years ago
Thomas gives a short presentation about VisualData which is a full-fledged metadata management framework based on ...
46 views
Take my Full Python Course Here: https://www.analystbuilder.com/courses/pandas-for-data-analysis In this series we will be ...
114,312 views