ViewTube

ViewTube
Sign inSign upSubscriptions
Filters

Upload date

Type

Duration

Sort by

Features

Reset

741 results

Creative Suite Studio
3 Secrets EXPERTS Use to Insert Maps into MS Excel Spreadsheets

3 Secrets EXPERTS Use to Insert Maps into MS Excel Spreadsheets | Easy Step-by-Step Guide Description: Want to make your ...

3:27
3 Secrets EXPERTS Use to Insert Maps into MS Excel Spreadsheets

52 views

9 months ago

yusakru
AI Agent Converts Messy CSV to Report in 30 Seconds (Minimax Hackathon Project)

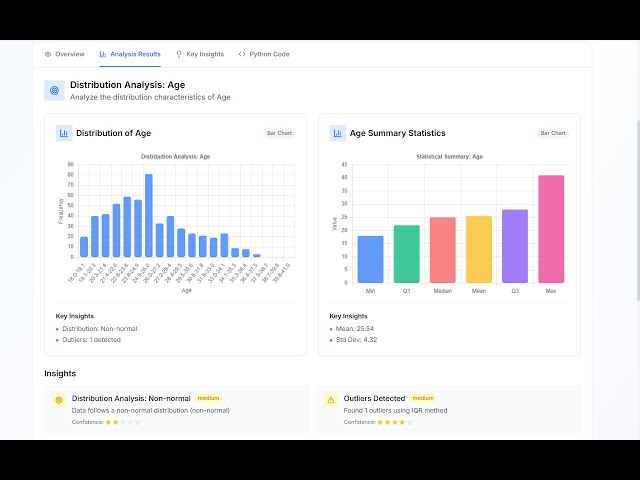
#MinimaxAgent #AIHackathon #NoCode #DataAnalysis #BusinessIntelligence #React #DataVisualization #ArtificialIntelligence.

1:10
AI Agent Converts Messy CSV to Report in 30 Seconds (Minimax Hackathon Project)

51 views

5 months ago

Alex Followell | AI Automation
How To Make Stunning Charts From a CSV in 60 Seconds! (n8n + Datawrapper)

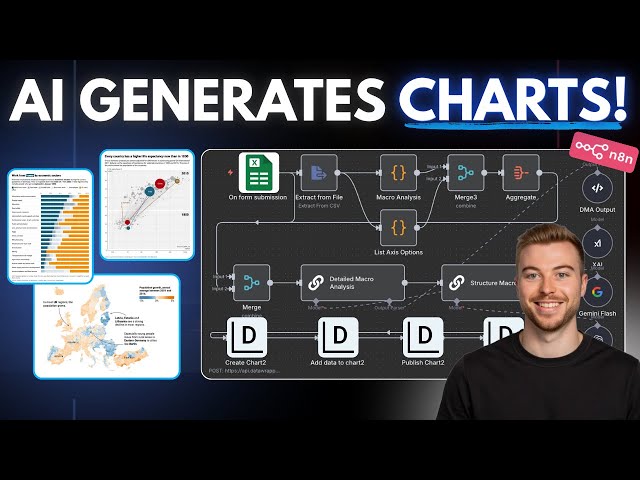
Access AI blueprints, tutorials, tools & expert help to level up fast! https://bit.ly/4lV67U2 Links Mentioned: - ⚡️ n8n: ...

26:27
How To Make Stunning Charts From a CSV in 60 Seconds! (n8n + Datawrapper)

2,185 views

6 months ago

Row To Result (R2R)
Excel DAYS & DAYS360 Function Tutorial – What's the Difference?

... "Remove Duplicates Excel" "Data analysis in Excel" "How to clean data in Excel" "Excel for data science" "Data visualization in ...

2:51
Excel DAYS & DAYS360 Function Tutorial – What's the Difference?

161 views

7 months ago

AdjoTech
How to create a Simple Dashboard Report in Microsoft Excel

How to create a Simple Dashboard Report in Microsoft Excel Want to turn boring data into a clear, professional dashboard in ...

18:11
How to create a Simple Dashboard Report in Microsoft Excel

107 views

12 days ago

Alex Followell | AI Automation
Turn CSVs into Charts & Insights in Seconds! (n8n)

Join the Skool AI Community – blueprints, tutorials, tools & expert help to level up fast! https://bit.ly/454oVuE Links ...

21:34
Turn CSVs into Charts & Insights in Seconds! (n8n)

11,149 views

8 months ago

360 CodeCamp
Excel Chart Mastery: Transforming Data into Visual Insights

Unlock the power of visual communication and transform your raw Excel data into compelling, insightful charts with our ...

1:21:00
Excel Chart Mastery: Transforming Data into Visual Insights

60 views

10 months ago

360 CodeCamp
Excel Basics for Data Analysis - Preparing Data with Microsoft Excel

Dive into the world of data analysis with this beginner-friendly Excel tutorial! Learn the essential skills to prepare data for analysis ...

1:26:28
Excel Basics for Data Analysis - Preparing Data with Microsoft Excel

70 views

1 year ago

Majok Wutchok Studio
Learn Excel in Under 3 Hours | Pivot Tables, Lookups, Data Cleaning | #excel #data

MicrosoftLearn, #MicrosoftCertification - Career development #Azure - Cloud technology #Microsoft365 #PowerPlatform #AI ...

2:38:36
Learn Excel in Under 3 Hours | Pivot Tables, Lookups, Data Cleaning | #excel #data

61 views

8 months ago

Analytics Advisors
1. Microsoft Excel for Absolute Beginners: Start Here!

Welcome to Analytics Advisors – your comprehensive learning hub for mastering data analytics, data visualization, and business ...

13:47
1. Microsoft Excel for Absolute Beginners: Start Here!

65,158 views

7 months ago

SARA Institute of Data Science
Natalia Kiseleva | Data Visualization using Excel Session 2-4

SARA Institute was founded in April 2023 by Dr. Ajay Kumar Koli & Dr. Kiran Lata. How to Donate to SARA: UPI ID: ...

1:07:59
Natalia Kiseleva | Data Visualization using Excel Session 2-4

64 views

7 months ago

Analytics Advisors
4. Learn Microsoft Excel References the Right Way – Most People Get This Wrong!

Welcome to Analytics Advisors – your comprehensive learning hub for mastering data analytics, data visualization, and business ...

15:23
4. Learn Microsoft Excel References the Right Way – Most People Get This Wrong!

66,221 views

7 months ago

Creative Suite Studio
3 Simple Tricks to Master Converting TEXT to Chart in Excel

3 Simple Tricks to Master Converting TEXT to Chart in Excel Are you tired of manually creating charts in Excel? Do you want to ...

4:33
3 Simple Tricks to Master Converting TEXT to Chart in Excel

46 views

9 months ago

SARA Institute of Data Science
Natalia Kiseleva | Data Visualization using Excel Session 4-4

SARA Institute was founded in April 2023 by Dr. Ajay Kumar Koli & Dr. Kiran Lata. How to Donate to SARA: UPI ID: ...

1:02:22
Natalia Kiseleva | Data Visualization using Excel Session 4-4

50 views

6 months ago

Analytics Advisors
81. Excel Area Chart Tutorial | Create Stunning Dashboards Fast 🚀

Like | Comment | Subscribe for more Excel & Data Visualization tutorials #Excel #ExcelCharts #DataVisualization #Analytics ...

4:29
81. Excel Area Chart Tutorial | Create Stunning Dashboards Fast 🚀

4,684 views

1 day ago

SARA Institute of Data Science
Natalia Kiseleva | Data Visualization using Excel Session 3-4

SARA Institute was founded in April 2023 by Dr. Ajay Kumar Koli & Dr. Kiran Lata. How to Donate to SARA: UPI ID: ...

1:02:22
Natalia Kiseleva | Data Visualization using Excel Session 3-4

34 views

6 months ago

SARA Institute of Data Science
Natalia Kiseleva | Data Visualization using Excel Session 1-4

SARA Institute was founded in April 2023 by Dr. Ajay Kumar Koli & Dr. Kiran Lata. How to Donate to SARA: UPI ID: ...

55:33
Natalia Kiseleva | Data Visualization using Excel Session 1-4

100 views

7 months ago

Brad Peirson
Learn How to Create a Scatter Plot in Excel | X-Bar Chart Example

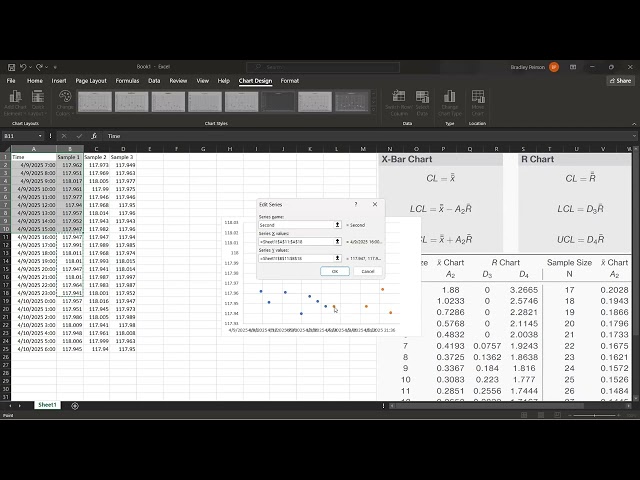
... comment, and subscribe for more Excel and data visualization tutorials! #ExcelTutorial #ScatterPlot #XBarChart #QualityControl ...

1:02:52
Learn How to Create a Scatter Plot in Excel | X-Bar Chart Example

20 views

10 months ago

Creative Suite Studio
Can You Calculate Your Age in JUST 5 Minutes with MS EXCEL?

Can You Calculate Your Age in JUST 5 Minutes with MS EXCEL? Learn how to calculate your age in just 5 minutes using ...

4:05
Can You Calculate Your Age in JUST 5 Minutes with MS EXCEL?

96 views

10 months ago

Codanics
Data Visualization Workshop Live in urdu hindi for everyone A-Z

WELCOME to our real-time Data Visualization boot-camp! Whether you're a student, freelancer, or professional, this Urdu/Hindi ...

1:03:35
Data Visualization Workshop Live in urdu hindi for everyone A-Z

3,659 views

Streamed 6 months ago