Upload date
All time
Last hour
Today
This week
This month
This year
Type
All
Video
Channel
Playlist
Movie
Duration
Short (< 4 minutes)
Medium (4-20 minutes)
Long (> 20 minutes)
Sort by
Relevance
Rating
View count
Features
HD
Subtitles/CC
Creative Commons
3D
Live
4K
360°
VR180
HDR
144,188 results
In this video we talk about how we deal with the fact that the earth is a globe when making maps.
361 views
3 years ago
Customer Journey Maps are all over the place. They can be a great tool to structure research data, get valuable user insights and ...
52,802 views
7 years ago
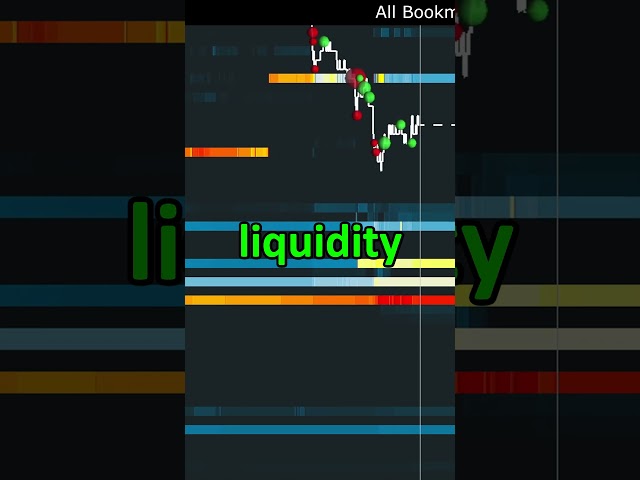
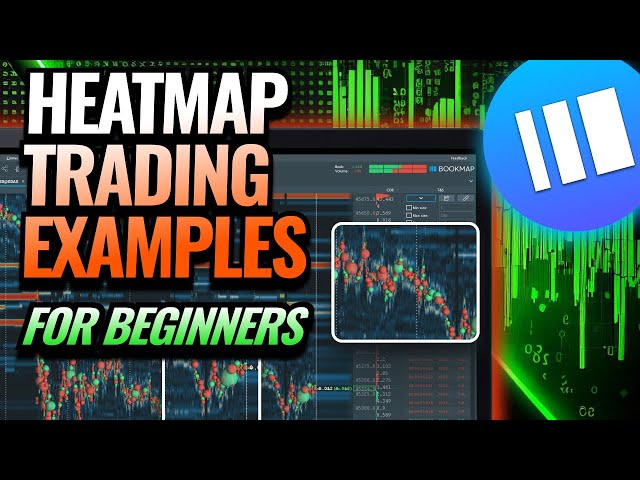
Use the liquidity heatmap to spot trapped trader scenarios unfold. Click here to get started with Bookmap for FREE: ...
101,569 views
2 years ago
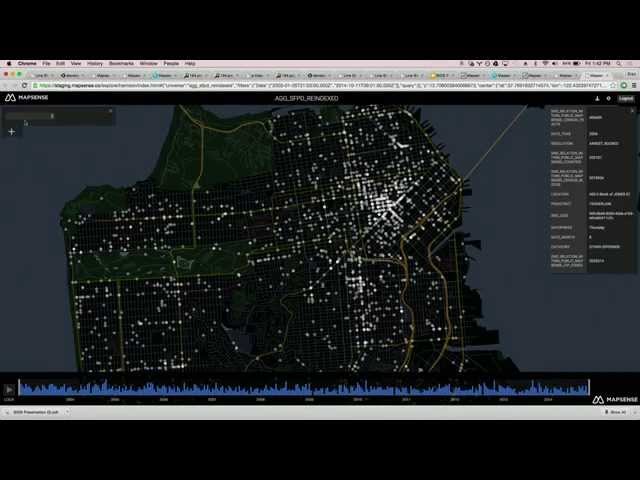
BIDS Data Science Lecture Series | February 13, 2015 | 1:00-2:30 p.m. | 190 Doe Library, UC Berkeley Speaker: Erez Cohen, ...
13,349 views
Streamed 10 years ago
FULL SHOW https://youtu.be/RNTvxHOO4A8 #UKRAINEVICTORY #RUSSIARETREAT Join this channel to get access to perks: ...
1,701 views
How the Bookmap heatmap is generated and the information it shows. A visualization of the historical liquidity within the order ...
93,752 views
A walkthrough of a simple mind map of key concepts in HEOR Want to learn how to tell better stories? Watch my video here ...
3,363 views
1 year ago
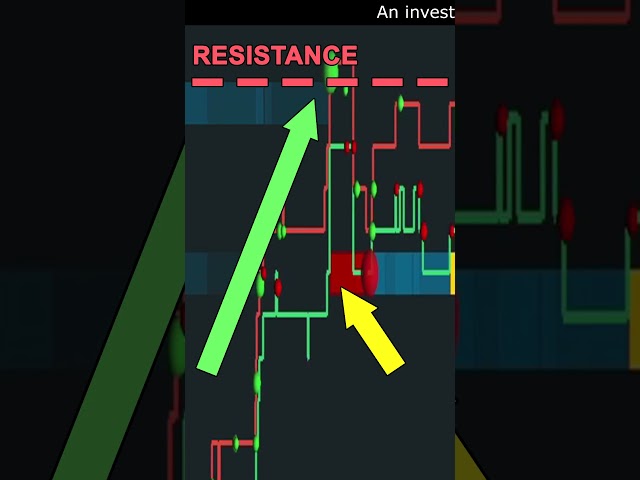
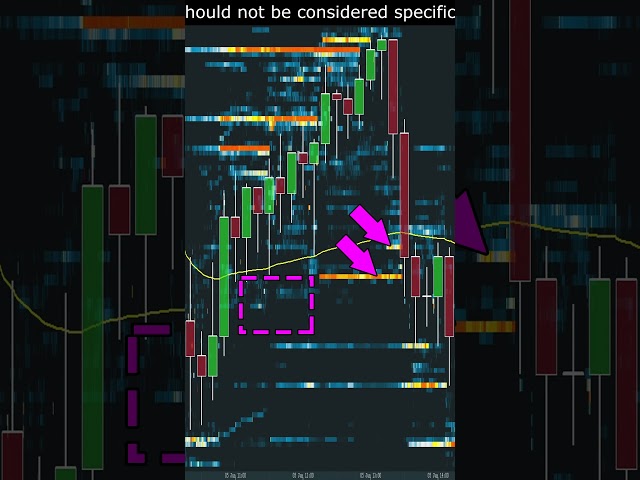
Passive liquidity can be used to measure the momentum of a move. Try it for yourself - get Bookmap for FREE here: ...
96,057 views
Learn to spot absorption to add confluence to your trades. Get started with Bookmap for FREE: https://bit.ly/3NDBR16 Follow ...
38,987 views
Entering a rallying market can be tricky. You don't want to buy the top, but at the same time you have a strong bias and can't wait ...
349,400 views
Introduction to network analysis and visualization with GEPHI. Datasets and tutorial here: ...
108,613 views
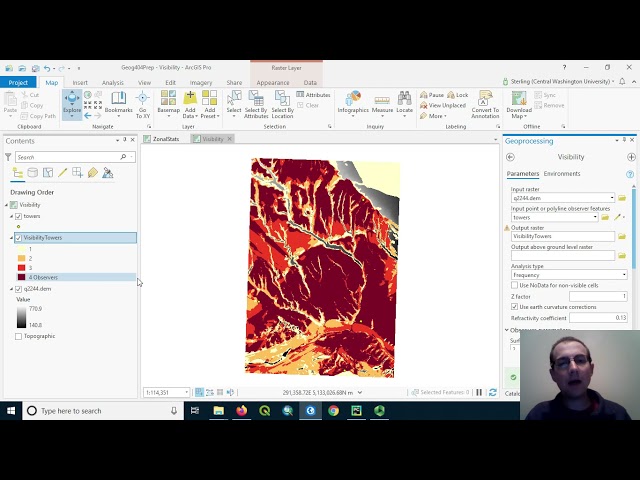
Dr. Sterling Quinn demonstrates how to perform a visibility analysis in ArcGIS Pro. This example identifies how many potential cell ...
11,834 views
4 years ago
Dr. Sterling Quinn demonstrates how to perform a visibility analysis in QGIS. This scenario determines how many potential cell ...
3,618 views
GIS: Difference between Heat Map and Hot Spot Analysis? Helpful? Please support me on Patreon: ...
45 views
We answer the question, what is a liquidity heatmap? And what's heatmap trading? We also look at the advantages of using a ...
84,628 views
Alexander Hendorf - Data Analysis and Map-Reduce with mongoDB and pymongo [EuroPython 2015] [22 July 2015] [Bilbao, ...
998 views
10 years ago
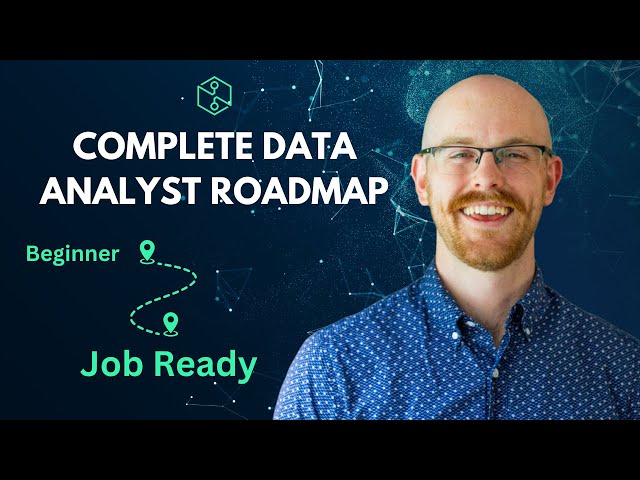
The Data Analyst Roadmap on AnalystBuilder.com is one of the best resources to get up to speed and job ready. Link to Bundle: ...
61,751 views
In this comprehensive GIS tutorial, we'll move beyond basic mapping to answer a critical urban planning question: How ...
2,569 views
7 months ago
my first map analysis! please sub and all that good shit its my first one so if i messed it !! thank you! Tags! glitch weapons guns ...
39 views
14 years ago
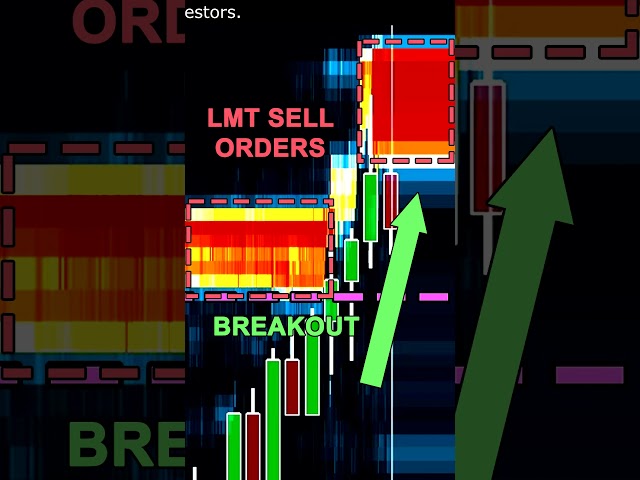
High liquidity can act like a magnet for price. This can be used to provide context for breakouts. Get started with Bookmap for ...
266,177 views