Upload date
All time
Last hour
Today
This week
This month
This year
Type
All
Video
Channel
Playlist
Movie
Duration
Short (< 4 minutes)
Medium (4-20 minutes)
Long (> 20 minutes)
Sort by
Relevance
Rating
View count
Features
HD
Subtitles/CC
Creative Commons
3D
Live
4K
360°
VR180
HDR
3,671,921 results
This comprehensive tutorial will teach you everything you need to know about Excel chart types, chart customization, and creating ...
108,229 views
1 year ago
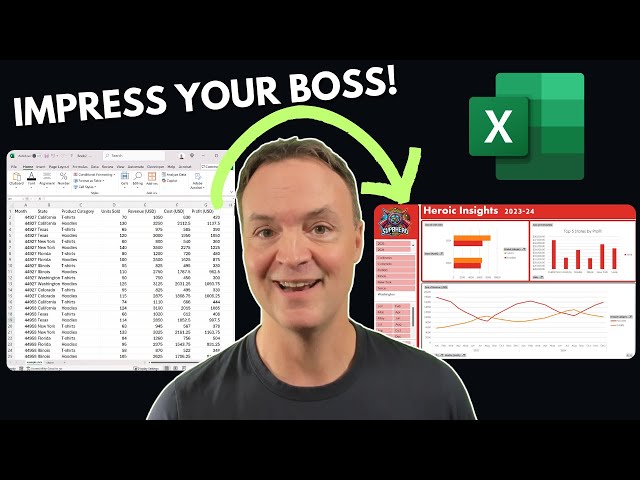
Build an interactive Excel dashboard for better data visualization in less than 20 minutes. ❗Master Excel with my courses: ...
75,268 views
Learn Excel in just 2 hours: https://kevinstratvert.thinkific.com In this step-by-step tutorial, learn how to pull together charts in Excel.
1,238,875 views
2 years ago
Download the free course files and follow along here: ➡️https://www.simonsezit.com/charts-and-dashboards-in-excel-demo-files ...
12,299 views
Data Visualization Monthly Budget Tracker https://shorturl.at/fhlwz.
62,772 views
3 years ago
... DOWNLOAD Free Excel file for this video: https://view.flodesk.com/pages/63dd44d5781752946ff2af78 In this video we'll build a ...
1,744,367 views
In this video, you'll learn how to visualize data totals, trends, geographical data, and more with Excel's TOP 5 data visualization ...
6,978 views
AD: Sign up to enroll for a 7-day free trial with Coursera now!
3,060,340 views
Learn Data Analysis Essentials in Excel in Just 12 minutes! Take our Data Analyst Program here: ...
156,297 views
FREE Course Files & Projects https://lukeb.co/excel_files Supporter Access: Problems, Certificate, & More ...
2,153,207 views
OFF My Dashboards Course (code: SAVE50) https://chandoo.org/wp/excel-school-program/ ~ Become an Excel Dashboard ...
63,801 views
2 months ago
Ready to transform your spreadsheets from ordinary to extraordinary? In this tutorial, you'll learn how to take raw, unorganized ...
107,546 views
In this step-by-step tutorial, learn how to create dynamic and interactive Excel dashboards. With a dashboard, you can showcase ...
3,526,985 views
4 years ago
"️ IBM - Data Analyst ...
14,289 views
Excel Data Analysis Full Course Tutorial (7+ Hours) Get Ad-Free Training by becoming a member today!
1,809,009 views
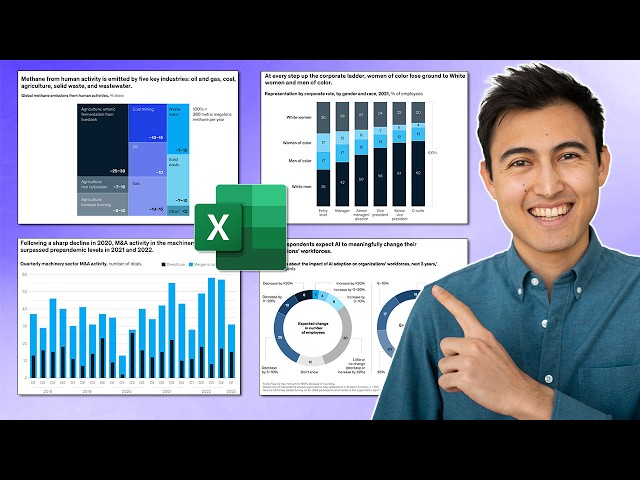
... Free Excel file for this video: https://careerprinciples.myflodesk.com/mssfixa655 In this video, I make 3 McKinsey visuals in Excel ...
445,014 views
https://other-levels.com/products/one-time-full-access The #1 Website Worldwide for Excel Dashboard Templates, Reports, ...
6,380,898 views
Follow me on LinkedIn https://www.linkedin.com/in/luke-b/ OR on X/Twitter https://twitter.com/LukeBarousse Subscribe to ...
242,011 views
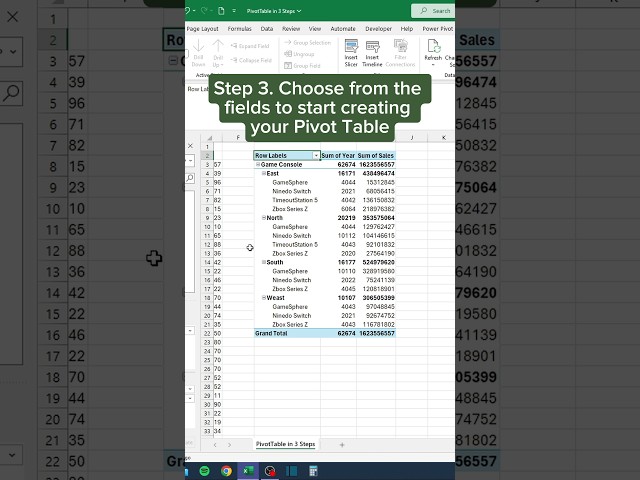
Step one select the data or press contrl plus a step two go to insert Tab and select pivot table choose new or existing worksheet ...
1,200,902 views
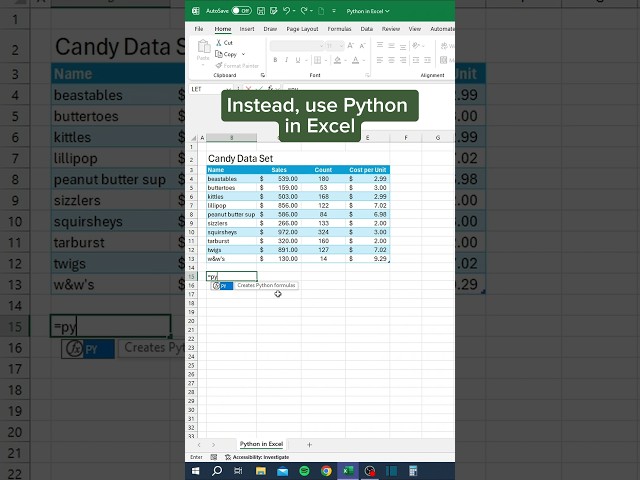
In this video we show a basic function of Python in Excel. Don't forget to register for a FREE Excel Class at the link below!
588,983 views
Links mentioned in this video ⬇️ Exercise File ...
246,643 views
Saw the intern visualizing his data like this so I showed him this tip activate python store your data as a python data.
75,041 views
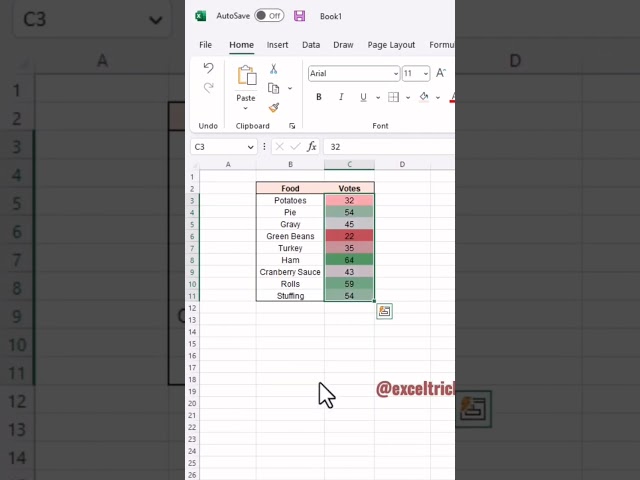
Data visualization in excel | 2 Easy data visualization tools |
86,147 views
Welcome to this beginner's tutorial on how to use Microsoft Power BI! In this video, I will guide you through importing data from an ...
199,595 views
Excel Visualize Your Data Tutorial Get Ad-Free Training by becoming a member today!
13,916 views
10 months ago