ViewTube

ViewTube
Sign inSign upSubscriptions
Filters

Upload date

Type

Duration

Sort by

Features

Reset

697 results

Scoop Analytics
What is Data Visualization

What is data visualization, why it helps business teams make faster decisions, and the most common mistake people make when ...

2:20
What is Data Visualization

0 views

14 hours ago

Scoop Analytics
What is data visualization — and why does it matter for your business decisions?

In this video, we break down data visualization in plain English: what it is, why it helps business teams make faster decisions, and ...

2:20
What is data visualization — and why does it matter for your business decisions?

0 views

10 hours ago

Nirand Pisutha-Arnond
IDA68: Data Visualization with Python

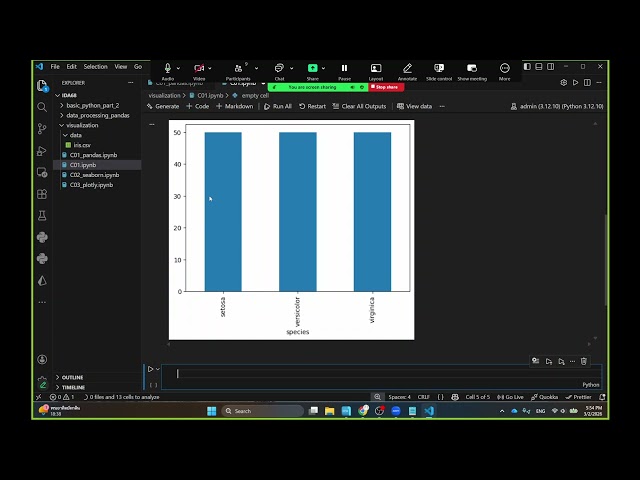
Okay i'll just put it here and I'm going to go to data visualizations okay and you can uh download the zip files okay and then I can ...

55:00
IDA68: Data Visualization with Python

0 views

6 hours ago

Relative Insight
Data visualization tools are just dashboards without Relative Insight

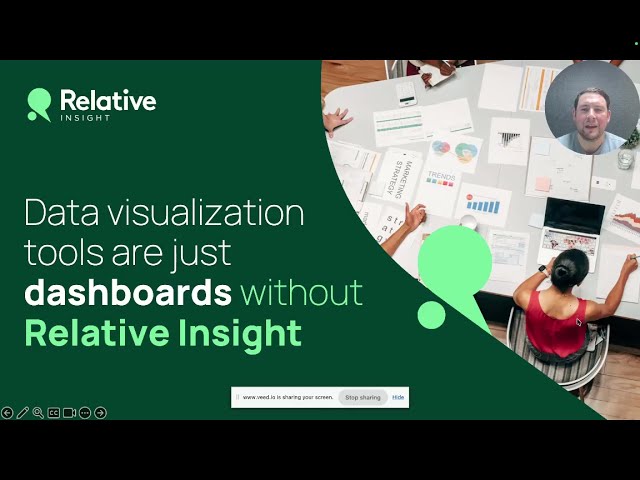
In this on-demand webinar James Cuthbertson, CRO at Relative Insight, explains how leading organizations combine quantitative ...

10:12
Data visualization tools are just dashboards without Relative Insight

0 views

8 hours ago

INFORMATION
Sales Data Visualization challenge

code link https://colab.research.google.com/drive/19dSHtZNX4EAuwZ6fQbK2geTAH6LMZ1SB?usp=sharing.

11:27
Sales Data Visualization challenge

4 views

20 hours ago

Neotoma devia
Stratigraphic data visualization and databasing with Tilia software

On February 24th, 2026, Nick Hoffman, data steward at the Neotoma Paleoecology Database, led a virtual workshop on using Eric ...

42:08
Stratigraphic data visualization and databasing with Tilia software

1 view

2 hours ago

Rodrigo Chin - Data Analytics VIP
Stop Guessing, Start Visualizing: Your First Tableau Dashboard Made Easy!

Ready to build your first interactive dashboard? In this tutorial, I'll show you how to go from raw data to a stunning, modern ...

22:04
Stop Guessing, Start Visualizing: Your First Tableau Dashboard Made Easy!

0 views

9 hours ago

gdotv – graph database IDE
The Future of Graph Data Visualization in the Age of AI

AI is changing how we visualize and interact with data. In a world where users can simply ask questions of their data in natural ...

27:25
The Future of Graph Data Visualization in the Age of AI

0 views

2 hours ago

Uzair Mehmood
Microsoft Excel Interactive Dashboard | Job Market Overview | Data Visualization Project

In this project, I built an interactive Microsoft Excel dashboard to analyze job market trends and extract meaningful insights from ...

0:43
Microsoft Excel Interactive Dashboard | Job Market Overview | Data Visualization Project

0 views

17 hours ago

Koenig Solutions
Upgrade Your Reports with Powerful Conditional Formatting

Like | Comment | Subscribe for more expert-led Excel, Power BI, and data visualization sessions. #KoenigWebinars ...

1:23:58
Upgrade Your Reports with Powerful Conditional Formatting

33 views

Streamed 16 hours ago

DataBeli
Easy Dashboard Creation with Databricks AI #databricks #dashboard #ai #visualization

Full Demo: https://youtu.be/vanOstY5Jes In this video, we showcase the powerful capabilities of Databricks in building ...

0:48
Easy Dashboard Creation with Databricks AI #databricks #dashboard #ai #visualization

55 views

14 hours ago

Excel Tricks Tips
How to Create a Lollipop Chart in Excel (Native Visual) | Modern Dashboard Trick #datavisualization

Learn how to create a Lollipop Chart in Excel using only native visuals—no custom visuals or App Source downloads required.

5:09
How to Create a Lollipop Chart in Excel (Native Visual) | Modern Dashboard Trick #datavisualization

0 views

15 hours ago

Simplilearn
AI Powered Business Analytics with Excel Full Course | Excel For Business Analytics | Simplilearn

It then covers advanced Excel features for data visualization, interactive dashboards, and business reporting. You will explore ...

4:59:37
AI Powered Business Analytics with Excel Full Course | Excel For Business Analytics | Simplilearn

475 views

Streamed 7 hours ago

Software Career Camp
R Programming in 30 Seconds 🔥 | Beginner Guide
1:11
R Programming in 30 Seconds 🔥 | Beginner Guide

0 views

0

Design Zone 1.0
How to Set Trendline to 0 in Google Sheets | Force Intercept to Zero (Easy Tutorial)

... to zero and adjust axis settings for accurate data visualization. This method is perfect for students, business analysts, marketers, ...

1:13
How to Set Trendline to 0 in Google Sheets | Force Intercept to Zero (Easy Tutorial)

0 views

13 hours ago

Elodie Bouzbib
Haptixel: Encoding Data through Cutaneous Force-based Encountered-Type Fingertip Haptics

... Louis Badr, Claudio Pacchierotti, Anatole Lécuyer, Arnaud Prouzeau Abstract: Data visualization benefits from non-visual cues ...

3:44
Haptixel: Encoding Data through Cutaneous Force-based Encountered-Type Fingertip Haptics

2 views

11 hours ago

Rand Fishkin
New usage graphs in Spark Toro

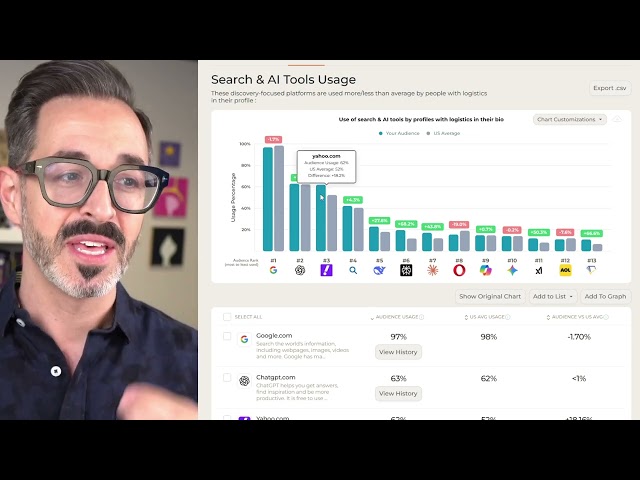
The number one rule of data visualization: make it obvious. We just updated SparkToro's graphs to show both usage and the delta ...

1:10
New usage graphs in Spark Toro

0 views

12 hours ago

IIST Computer Institute
How to transpose data in excel #excel #computereducation #exceltips #exceltricks #computercourses

... Data Analysis Power BI Full Course Tableau Tutorial Data Visualization Course SQL for Data Science Basic Statistics for Data ...

0:18
How to transpose data in excel #excel #computereducation #exceltips #exceltricks #computercourses

0 views

1 hour ago

Uzair Mehmood
IBM Cognos Analytics Dashboard | Shoperoo Retail Sales Insights - 2

This project demonstrates practical skills in business intelligence reporting, dashboard design, and data visualization using ...

0:44
IBM Cognos Analytics Dashboard | Shoperoo Retail Sales Insights - 2

0 views

17 hours ago

Data with Clarence
Day 2: Power BI Exam Prep (PL-300) | Live Study Session | FREE YouTube Live

... Power BI data preparation & modeling ✓ DAX fundamentals you must know ✓ Data visualization & report design best practices ...

2:11:50
Day 2: Power BI Exam Prep (PL-300) | Live Study Session | FREE YouTube Live

117 views

Streamed 1 day ago