Upload date
All time
Last hour
Today
This week
This month
This year
Type
All
Video
Channel
Playlist
Movie
Duration
Short (< 4 minutes)
Medium (4-20 minutes)
Long (> 20 minutes)
Sort by
Relevance
Rating
View count
Features
HD
Subtitles/CC
Creative Commons
3D
Live
4K
360°
VR180
HDR
3,134 results
To learn for free on Brilliant, go to https://brilliant.org/techwithtim . Brilliant's also given our viewers 20% off an annual Premium ...
6,752 views
8 days ago
Our favourite plotting library may just be matplotlib again now that we made it interactive with a puck! It may sounds strange at first, ...
6,173 views
4 days ago
Matplotlib Python Tutorial for Beginners | Data Visualization in Python Matplotlib is a python library used for data ...
4,882 views
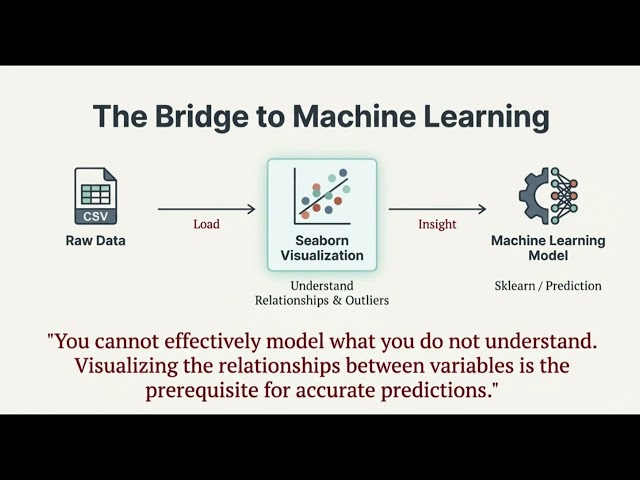
This video today is a crash course on Seaborn, a data visualization library for Python built on top of Matplotlib. It makes it super ...
5,840 views
2 weeks ago
Learn Python NumPy and Matplotlib libraries from scratch in this complete beginner-friendly tutorial. In this video, we explain how ...
23 views
3 weeks ago
Matplotlib is powerful — but many developers struggle once they go beyond a simple plot. In this video, you'll unlock Matplotlib ...
121 views
4 weeks ago
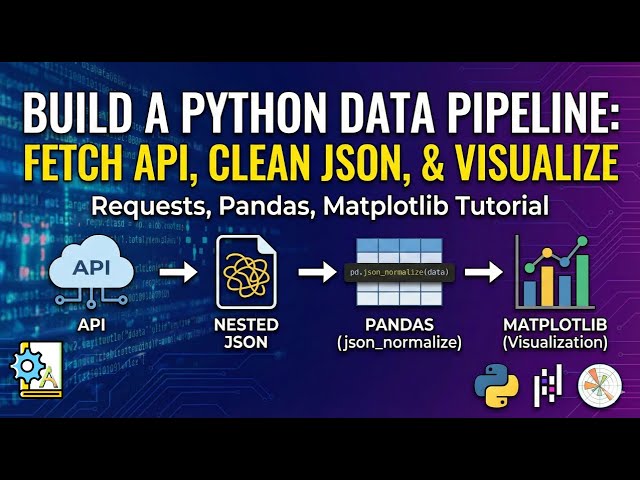
In this video, we build a complete end-to-end data pipeline using Python. You will learn how to fetch real data from an API, handle ...
18 views
An introductory notebook covering the fundamentals of data visualization using Matplotlib. This project demonstrates how to ...
3 views
1 view
11 days ago
In this video, you'll learn how to create a polar plot in Python using Matplotlib and NumPy. Polar plots are useful for visualizing ...
Day 19/365 Today I explored Seaborn, the visualization library that makes data beautiful & meaningful. In 40–60 seconds, ...
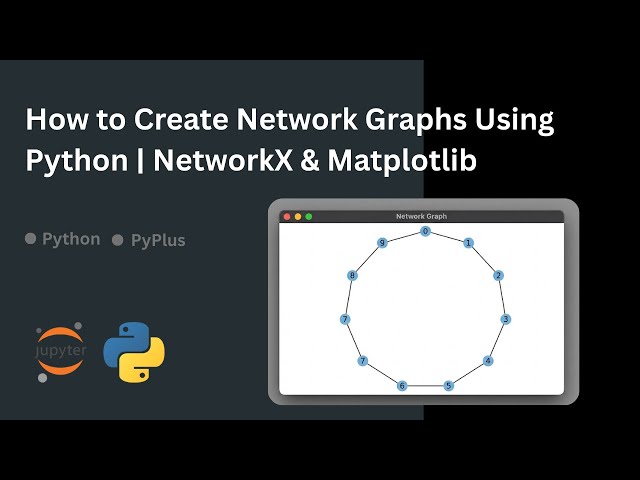
What are network graphs and how can you visualize them using Python? In this video, you'll learn how to create and ...
0 views
This video gives a clear and concise explanation of Matplotlib for quick revision and exam preparation Learn how to create ...
4 views
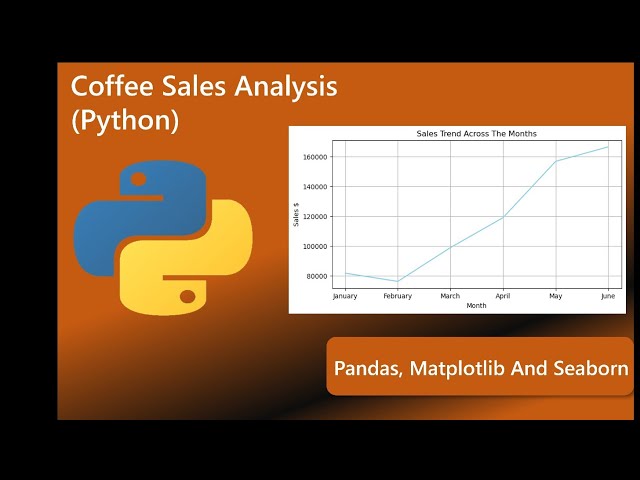
This video shows a complete coffee sales analysis using Python. The analysis is done with Pandas for data cleaning, ...
41 views
In this video learn the basics of how to make a pie chart in Matplotlib. And see how I used it to analyze some of my chess game ...
19 views
What is a Funnel Chart and how can you create one using Python and Matplotlib? In this video, you'll learn how to create a ...
2 views
In this video, I present my Retail Sales Exploratory Data Analysis (EDA) project using Python. This project focuses on analyzing ...
34 views
9 days ago
00:00 Welcome, and hunkering 01:42 We're talking about primes 07:00 Let's code! Our first prime finding algorithm 22:42 Modular ...
798 views
Streamed 10 days ago
AI/ML Python — Job Ready Course ...
402 views
Python code file: ...
156 views