Upload date
All time
Last hour
Today
This week
This month
This year
Type
All
Video
Channel
Playlist
Movie
Duration
Short (< 4 minutes)
Medium (4-20 minutes)
Long (> 20 minutes)
Sort by
Relevance
Rating
View count
Features
HD
Subtitles/CC
Creative Commons
3D
Live
4K
360°
VR180
HDR
37 results
Today's Topic: Matplotlib Make Center Circle Transparent Thanks for taking the time to learn more. In this video I'll go through your ...
0 views
5 hours ago
Welcome to the official orientation for your 180-Day "Job Ready" AI Engineer Course. This isn't just another tutorial series. This is ...
18 views
1 day ago
Comment visualiser les performances de votre modèle avec Matplotlib ? Découvrez comment utiliser Matplotlib pour créer des ...
13 views
6 hours ago
Python reigns supreme in data analysis. However, data placed in a table can't speak for itself. Learn to add plots to your ...
13 hours ago
Build a Private, Local Data Explorer with AI! Tired of uploading sensitive data to cloud-based AI tools? In this video, we build a ...
15 views
18 hours ago
Code: https://github.com/ash322ash422/youtube/blob/main/matplotlib/L06-subplot.ipynb Complete playlist for matlotlib: ...
4 views
Python is one of the most powerful and in-demand programming languages for Data Science. If you want to build a career in Data ...
3 hours ago
Assalam-o-Alaikum! In this video, I am demonstrating the complete working prototype of the "Smart Health Monitoring System," a ...
7 views
4 hours ago
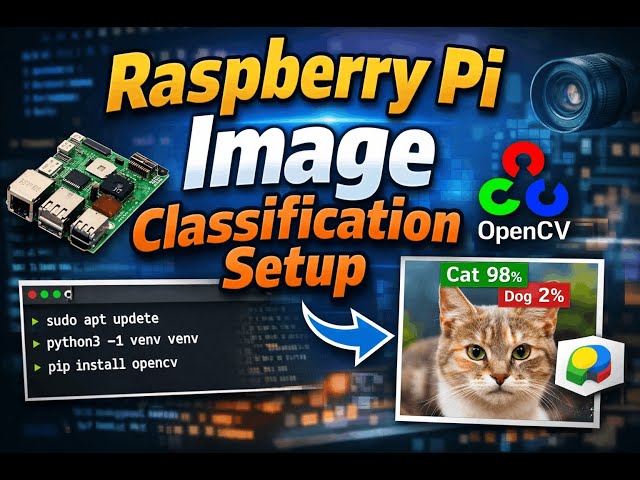
In this video, we set up a complete image classification and computer vision environment on Raspberry Pi from scratch. You'll ...
16 views
17 hours ago
Download the E-Commerce database used in this video here: ...
19 views
23 hours ago
Erfahren Sie, wie Sie Ihre `matplotlib` Diagramme einfach anpassen können, indem Sie Stilparameter mit einer `matplotlibrc` ...
27 minutes ago
Want to learn how real data analysts work on industry datasets? In this video, we perform Exploratory Data Analysis (EDA) on a ...
7 hours ago
Is video mein hum Multiple Plots aur Subplots using Matplotlib ko step-by-step seekhenge jo Data Visualization aur ...
20 hours ago
This video highlights why choosing the right color map is critical for scientific integrity. A poorly chosen palette can ...
8 views
In this video, you will get NPTEL Data Science for Engineers Week 3 Assignment Answers for the January–April 2026 session.
Totally not AI generated... নতুন সিরিজের শুরু! Complete Machine Learning Course in Bangla | From Noob ...
23 views
Per i miei percorsi formativi completi a prezzo scontato: ...
1 view
15 hours ago
چرا شبکههای عصبی کانولوشنال (Convolutional Neural Networks یا CNN) پادشاه بلامنازع دنیای پردازش تصویر هستند؟ چون آنها ...
21 hours ago
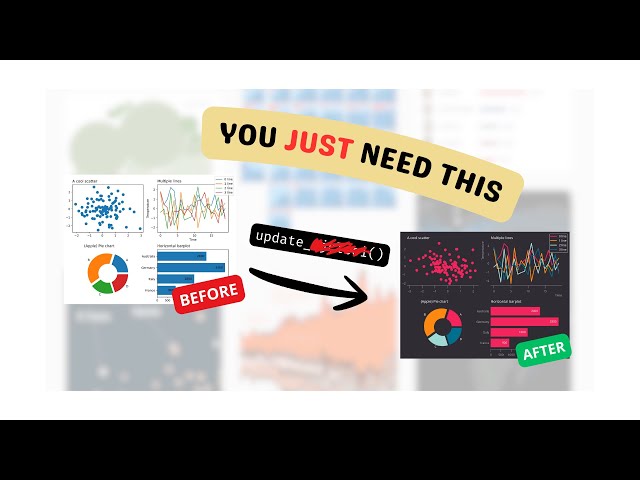
Become a data visualization expert with a 30% discount: https://www.matplotlib-journey.com/ What if there was a way to make any ...
67 views
This video demonstrates the results of replacing the Matplotlib graphics library previously used in NVHLab with PyQtGraph.