ViewTube

ViewTube
Sign inSign upSubscriptions
Filters

Upload date

Type

Duration

Sort by

Features

Reset

772 results

Visme
My Favorite Graph Maker Tool

... charts, analytics reporting and it makes my data look SO good. #dataanalytics #datavisualization #dataviz #infographics #graph ...

0:11
My Favorite Graph Maker Tool

946 views

1 year ago

Lore So What
4 simple tips to visualise your data #shorts

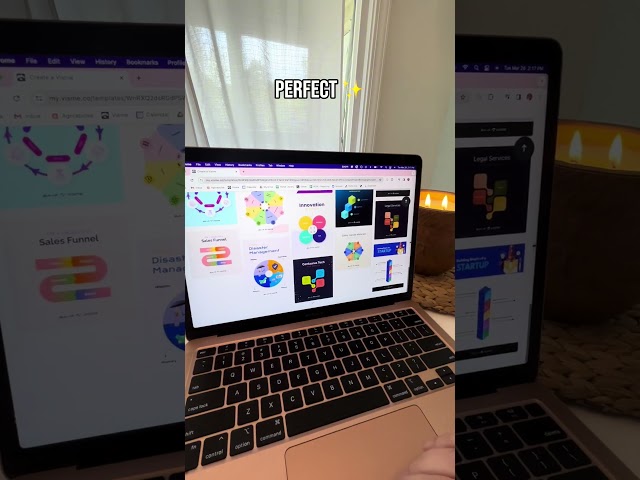
These are my 4 tips to visualise your data that I learned on the the way...

0:35
4 simple tips to visualise your data #shorts

696 views

3 years ago

Thinkmetrics
Productive morning routine of a data analyst #dataanalyst #notion
0:30
Productive morning routine of a data analyst #dataanalyst #notion

813 views

1 year ago

Alex The Analyst
Do you need to learn SQL if you can do everything in Python?  #Python #dataanalysis #SQL

... Data Analysis Specialization - https://coursera.pxf.io/AoYOdR Tableau Data Visualization - https://coursera.pxf.io/MXYqaN ...

0:51
Do you need to learn SQL if you can do everything in Python? #Python #dataanalysis #SQL

73,913 views

2 years ago

DailyTech
🤖 Data Analysis with ChatGPT | Turn Raw Data into Insights Instantly

See how ChatGPT can analyze your data and generate insights in just minutes! In this video, I demonstrate how to: ✓ Upload ...

3:24
🤖 Data Analysis with ChatGPT | Turn Raw Data into Insights Instantly

71 views

6 months ago

MICHELLE BANNON
Visualizing Data
7:03
Visualizing Data

54 views

10 months ago

Nataindata
Ditch ChatGPT and Excel for Data Analysis.Try Julius AI - Your Personal Data Analyst. #shorts

Try Julius AI - Your Personal Data Analyst: ✓ from Forecasting ✓ to generating Visualisations ✓ or training Neural Networks ✓ or ...

0:21
Ditch ChatGPT and Excel for Data Analysis.Try Julius AI - Your Personal Data Analyst. #shorts

11,859 views

2 years ago

The Data Girl
Power BI Dashboard | Cafe Sales Data | End-to-End Data Analysis

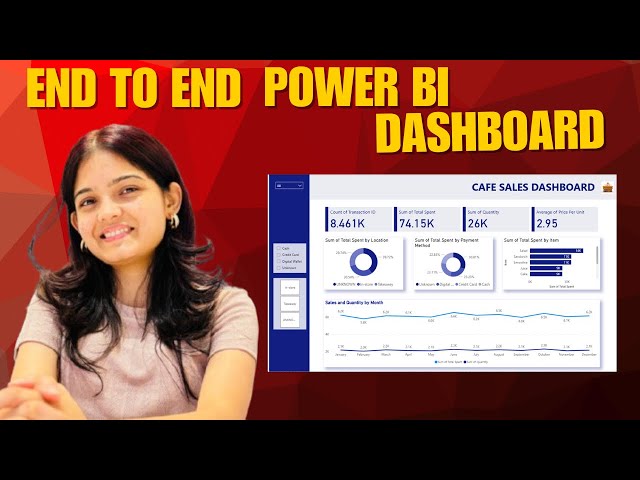
Watch the full Playlist of Power BI - https://www.youtube.com/playlist?list=PL5MLDAaSK7WuU6s8ag-UwIKeC3ho0LTg5 Watch ...

25:38
Power BI Dashboard | Cafe Sales Data | End-to-End Data Analysis

792 views

1 month ago

Tracy Wanjera
Data visualization using Excel.

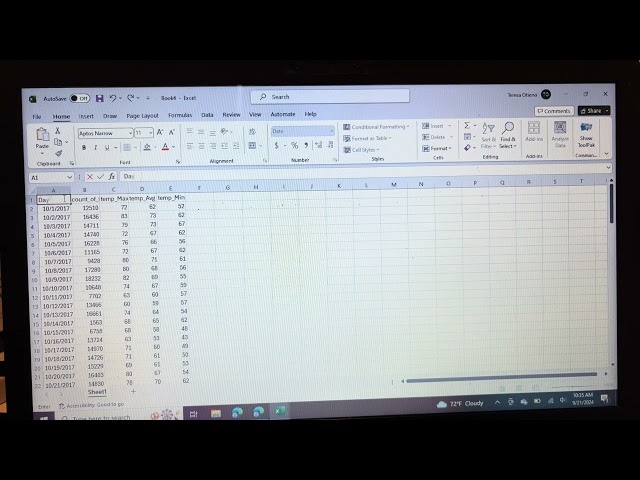
Using Excel to combine two datasets and perform data visualization.

4:09
Data visualization using Excel.

6 views

1 year ago

Pradnya
Power BI for Beginners: your first step into Data Visualisation.

Welcome to your first step into Data Visualization! In this beginner-friendly video, I'll walk you through what Power BI is, why it's ...

7:41
Power BI for Beginners: your first step into Data Visualisation.

31 views

8 months ago

Grey The Data Guy
Data Cleaning in Power BI | Quick Beginner Tutorial for Clean & Accurate Reports
0:33
Data Cleaning in Power BI | Quick Beginner Tutorial for Clean & Accurate Reports

121 views

6 months ago

The Power BI Guy
Power BI can feel overwhelming. Stick through it and you can create some amazing reports #powerbi
0:15
Power BI can feel overwhelming. Stick through it and you can create some amazing reports #powerbi

1,260 views

1 year ago

Alex The Analyst
#DataAnalyst #CareerPath

Let's take a look at the career path of a data analyst starting with an entry-level data analyst you just landed your first job what are ...

0:52
#DataAnalyst #CareerPath

106,725 views

2 years ago

Visme
My Favorite Data Slides Powerpoint Maker

#graphmaker #datavisualization #slidedeck #powerpoint #presentation #consulting #sales #marketing #analyticsreport.

0:11
My Favorite Data Slides Powerpoint Maker

281 views

11 months ago

Alex The Analyst
#DataAnalysis #DataAnalyst

How long does it actually take to become a data analyst to give you some context I mentioned over 100 people trying to become a ...

0:53
#DataAnalysis #DataAnalyst

21,397 views

2 years ago

Lore So What
Data Analyst Portfolio Tips #shorts

My best tips for your data analyst portfolio to get hired...

0:32
Data Analyst Portfolio Tips #shorts

515 views

3 years ago

deganza
Book: The Visual Data Language - The KNIME Way #shorts

#VisualDataLanguage #TechBook #DataScienceBook #AI #AnalyticsBook #NoCodeDataScience #DataVisualization ...

0:29
Book: The Visual Data Language - The KNIME Way #shorts

260 views

5 months ago

Nelson Mbigili
Real-Time Sensor Data Visualization with p5.js and Arduino

In this video, I show how to read sensor data from an Arduino and visualize the results in real-time using P5.js The data is ...

0:58
Real-Time Sensor Data Visualization with p5.js and Arduino

40 views

1 year ago

Promind AI
This is how you turn data into art with ProMind #microsoft #tech #office #aitools #ai

ProMind AI let's you plot graphs and various other visualisations for your data.

0:10
This is how you turn data into art with ProMind #microsoft #tech #office #aitools #ai

558 views

1 year ago

ION HowTo
How to Make a Bar Chart in Excel

How to Make Bar Charts in Excel. Excel bar chart and bar graphs tutorial for beginners. Creating a bar chart in Excel is an ...

0:24
How to Make a Bar Chart in Excel

30 views

1 year ago