ViewTube

ViewTube
Sign inSign upSubscriptions
Filters

Upload date

Type

Duration

Sort by

Features

Reset

517 results

The Data Girl
Power BI Dashboard | Cafe Sales Data | End-to-End Data Analysis

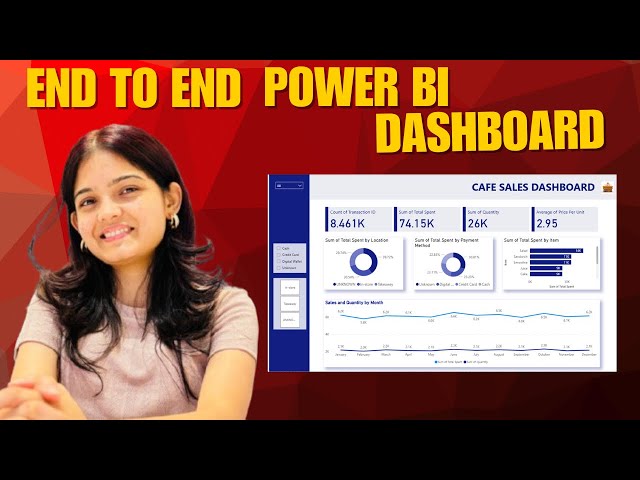
Watch the full Playlist of Power BI - https://www.youtube.com/playlist?list=PL5MLDAaSK7WuU6s8ag-UwIKeC3ho0LTg5 Watch ...

25:38
Power BI Dashboard | Cafe Sales Data | End-to-End Data Analysis

804 views

1 month ago

Tracy Wanjera
Data visualization using Excel.

Using Excel to combine two datasets and perform data visualization.

4:09
Data visualization using Excel.

6 views

1 year ago

Nelson Mbigili
Real-Time Sensor Data Visualization with p5.js and Arduino

In this video, I show how to read sensor data from an Arduino and visualize the results in real-time using P5.js The data is ...

0:58
Real-Time Sensor Data Visualization with p5.js and Arduino

40 views

1 year ago

Knock Out Data Insights
Power BI #WOW2024 W39: Creative data visuals & design

For more information on the Workout Wednesday challenge, go to: https://workout-wednesday.com/pbi-2024-w39/

22:58
Power BI #WOW2024 W39: Creative data visuals & design

86 views

1 year ago

Pradnya
Power BI for Beginners: your first step into Data Visualisation.

Welcome to your first step into Data Visualization! In this beginner-friendly video, I'll walk you through what Power BI is, why it's ...

7:41
Power BI for Beginners: your first step into Data Visualisation.

31 views

8 months ago

Brenton Piercy
Cheaper Boat Data Visualization. Pt. 1

Trying to get all the data that's on my boat into a clean easy spot to view and log. Here I show the new touchscreen from adafruit ...

3:39
Cheaper Boat Data Visualization. Pt. 1

292 views

2 years ago

The Data Girl
Import vs DirectQuery vs Live Connection in Power BI | CompleteGuide + Interview Questions Explained

Power BI Import vs Direct Query vs Live Connection — Complete Guide with Examples & Interview Questions In this video, we ...

16:46
Import vs DirectQuery vs Live Connection in Power BI | CompleteGuide + Interview Questions Explained

845 views

4 months ago

DailyTech
🤖 Data Analysis with ChatGPT | Turn Raw Data into Insights Instantly

See how ChatGPT can analyze your data and generate insights in just minutes! In this video, I demonstrate how to: ✓ Upload ...

3:24
🤖 Data Analysis with ChatGPT | Turn Raw Data into Insights Instantly

71 views

6 months ago

MICHELLE BANNON
Visualizing Data
7:03
Visualizing Data

54 views

10 months ago

ION HowTo
How to Create a Pie Chart in Excel

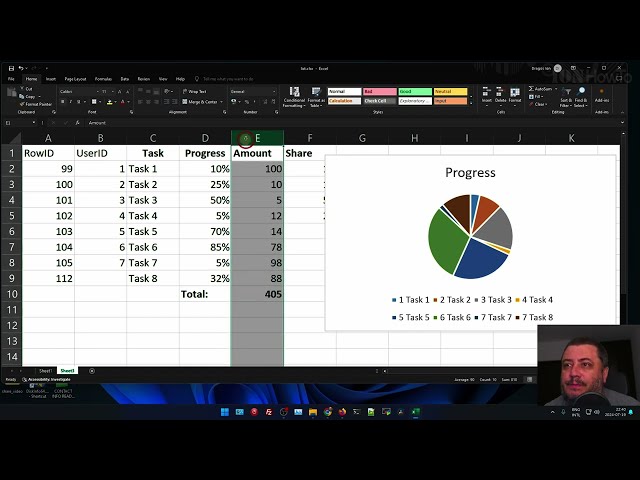
How to Create a Pie Chart in Excel - Step-by-Step Tutorial for Beginners Welcome to our detailed tutorial on creating pie charts in ...

5:24
How to Create a Pie Chart in Excel

22 views

1 year ago

Nicolas HEMAIN
Pivot Tables Made Easy: Turn Raw Data into Insights

Take a step forward on Excel : https://www.amazon.com/Excel-Formulas-PivotTables-Conditionnal-Formatting/dp/B0CG8F7TF9 ...

9:56
Pivot Tables Made Easy: Turn Raw Data into Insights

24 views

6 months ago

Zing Data
Create a dashboard using OpenAI on your phone in ONE MINUTE

Here's a challenge for data folks who like to ski: Create three data visualizations from raw data with NLP and OpenAI Make a ...

1:41
Create a dashboard using OpenAI on your phone in ONE MINUTE

223 views

3 years ago

The Data Girl
Power Query Editor Interface Tour | Complete Beginner Guide | Power BI Data Cleaning Explained

Watch My Complete Playlists ▶️ Power BI Full Playlist: ...

11:13
Power Query Editor Interface Tour | Complete Beginner Guide | Power BI Data Cleaning Explained

147 views

3 months ago

Empower Through Knowledge
Data Science Career Guide: 5 Essential Roles Explained (Data Engineer, Analyst, etc.)

Data Visualization Specialist: Craft compelling visuals that tell data stories. Dive into tools like Tableau and Power BI, even Excel ...

7:55
Data Science Career Guide: 5 Essential Roles Explained (Data Engineer, Analyst, etc.)

103 views

2 years ago

The Startup Stall Data Visualization Company
How To Quickly and Easily Sort Various Data Types in Excel

Are you an #Excel newbie? If so, learning how to sort your data is crucial to saving time and energy sifting through data. In the ...

2:55
How To Quickly and Easily Sort Various Data Types in Excel

7 views

1 year ago

Edwin Biju
1-12 Data Cleaning And Visualization

Data cleaning and visualization using python.

7:46
1-12 Data Cleaning And Visualization

1 view

2 months ago

Aaron Hunter
Learn how to handle data on AWS with these two books

Thank you Packt for sending me these books to read and share my own thoughts about. If you would like to grab a copy of these ...

2:09
Learn how to handle data on AWS with these two books

62 views

1 year ago

Oluwatosin Babalola
How I Used Data Analysis to Gain Over 6K Followers on TikTok in Just 2 Months! | Social Media Growth

... channel let's take a look at the dashboard I created to visualize the data and extract Insight in the average views by topic section ...

1:56
How I Used Data Analysis to Gain Over 6K Followers on TikTok in Just 2 Months! | Social Media Growth

200 views

1 year ago

Ian R
Joystick Controlling Visualization in Processing
0:19
Joystick Controlling Visualization in Processing

9 views

2 years ago

john jones
data analysis
4:55
data analysis

0 views

6 days ago