ViewTube

ViewTube
Sign inSign upSubscriptions
Filters

Upload date

Type

Duration

Sort by

Features

Reset

776 results

Lore So What
4 simple tips to visualise your data #shorts

These are my 4 tips to visualise your data that I learned on the the way...

0:35
4 simple tips to visualise your data #shorts

696 views

3 years ago

Visme
My Favorite Graph Maker Tool

... charts, analytics reporting and it makes my data look SO good. #dataanalytics #datavisualization #dataviz #infographics #graph ...

0:11
My Favorite Graph Maker Tool

948 views

1 year ago

Alex The Analyst
Do you need to learn SQL if you can do everything in Python?  #Python #dataanalysis #SQL

... Data Analysis Specialization - https://coursera.pxf.io/AoYOdR Tableau Data Visualization - https://coursera.pxf.io/MXYqaN ...

0:51
Do you need to learn SQL if you can do everything in Python? #Python #dataanalysis #SQL

74,018 views

2 years ago

MICHELLE BANNON
Visualizing Data
7:03
Visualizing Data

54 views

10 months ago

Thinkmetrics
Productive morning routine of a data analyst #dataanalyst #notion
0:30
Productive morning routine of a data analyst #dataanalyst #notion

814 views

1 year ago

Nataindata
Ditch ChatGPT and Excel for Data Analysis.Try Julius AI - Your Personal Data Analyst. #shorts

Try Julius AI - Your Personal Data Analyst: ✓ from Forecasting ✓ to generating Visualisations ✓ or training Neural Networks ✓ or ...

0:21
Ditch ChatGPT and Excel for Data Analysis.Try Julius AI - Your Personal Data Analyst. #shorts

11,882 views

2 years ago

Promind AI
This is how you turn data into art with ProMind #microsoft #tech #office #aitools #ai

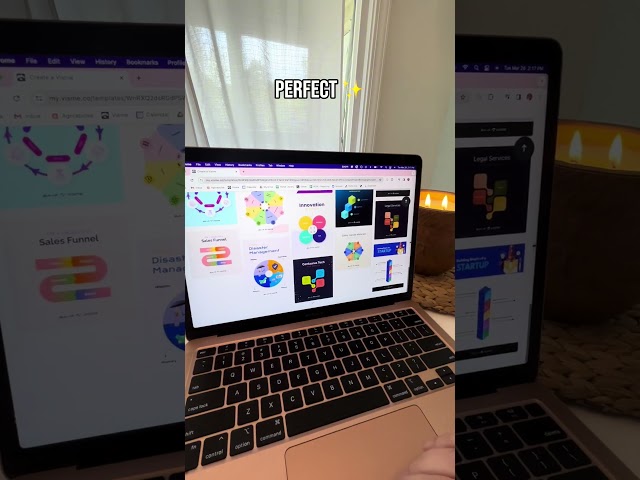
ProMind AI let's you plot graphs and various other visualisations for your data.

0:10
This is how you turn data into art with ProMind #microsoft #tech #office #aitools #ai

558 views

1 year ago

DailyTech
🤖 Data Analysis with ChatGPT | Turn Raw Data into Insights Instantly

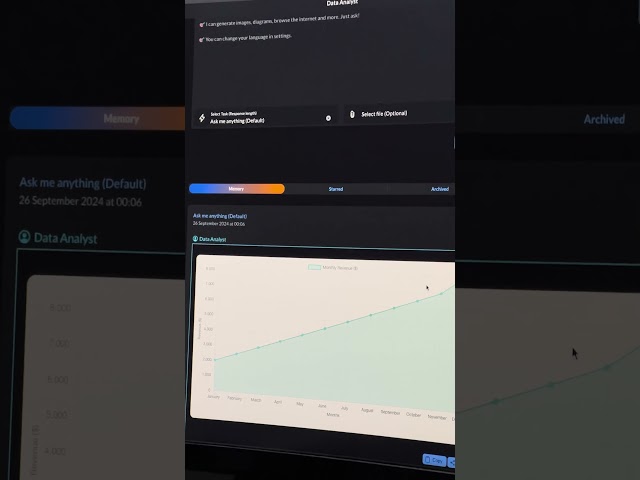
See how ChatGPT can analyze your data and generate insights in just minutes! In this video, I demonstrate how to: ✓ Upload ...

3:24
🤖 Data Analysis with ChatGPT | Turn Raw Data into Insights Instantly

71 views

6 months ago

The Data Girl
Power BI Dashboard | Cafe Sales Data | End-to-End Data Analysis

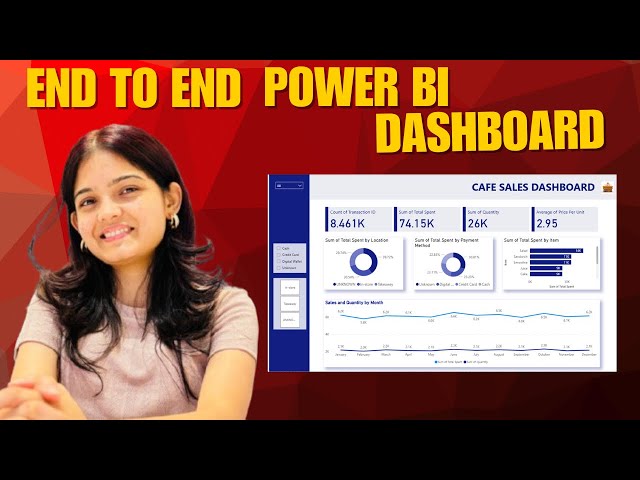
Watch the full Playlist of Power BI - https://www.youtube.com/playlist?list=PL5MLDAaSK7WuU6s8ag-UwIKeC3ho0LTg5 Watch ...

25:38
Power BI Dashboard | Cafe Sales Data | End-to-End Data Analysis

804 views

1 month ago

Tracy Wanjera
Data visualization using Excel.

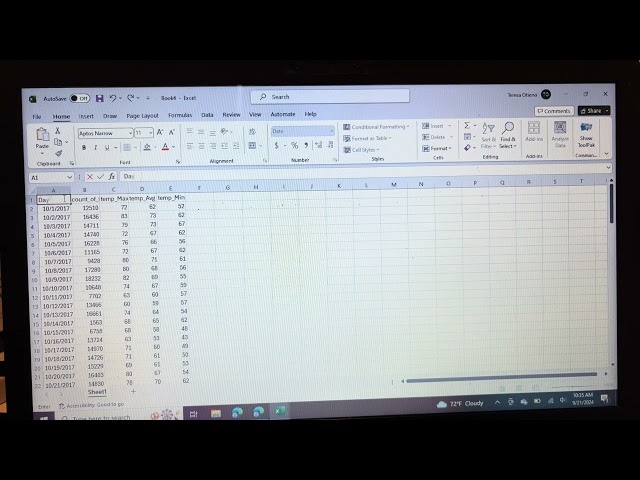
Using Excel to combine two datasets and perform data visualization.

4:09
Data visualization using Excel.

6 views

1 year ago

Lore So What
Data Analyst Portfolio Tips #shorts

My best tips for your data analyst portfolio to get hired...

0:32
Data Analyst Portfolio Tips #shorts

515 views

3 years ago

Alex The Analyst
#DataAnalysis #DataAnalyst

How long does it actually take to become a data analyst to give you some context I mentioned over 100 people trying to become a ...

0:53
#DataAnalysis #DataAnalyst

21,399 views

2 years ago

Pradnya
Power BI for Beginners: your first step into Data Visualisation.

Welcome to your first step into Data Visualization! In this beginner-friendly video, I'll walk you through what Power BI is, why it's ...

7:41
Power BI for Beginners: your first step into Data Visualisation.

31 views

8 months ago

deganza
Book: The Visual Data Language - The KNIME Way #shorts

#VisualDataLanguage #TechBook #DataScienceBook #AI #AnalyticsBook #NoCodeDataScience #DataVisualization ...

0:29
Book: The Visual Data Language - The KNIME Way #shorts

260 views

6 months ago

Alex The Analyst
#DataAnalyst #CareerPath

Let's take a look at the career path of a data analyst starting with an entry-level data analyst you just landed your first job what are ...

0:52
#DataAnalyst #CareerPath

107,015 views

2 years ago

The Power BI Guy
Power BI can feel overwhelming. Stick through it and you can create some amazing reports #powerbi
0:15
Power BI can feel overwhelming. Stick through it and you can create some amazing reports #powerbi

1,262 views

1 year ago

Lore So What
Difference Data Analyst vs Data Scientist EXPLAINED

The key difference between a data analyst vs a data scientist explained in a few seconds!

0:24
Difference Data Analyst vs Data Scientist EXPLAINED

378 views

3 years ago

Visme
My Favorite Data Slides Powerpoint Maker

#graphmaker #datavisualization #slidedeck #powerpoint #presentation #consulting #sales #marketing #analyticsreport.

0:11
My Favorite Data Slides Powerpoint Maker

282 views

11 months ago

Alex The Analyst
#DataAnalystSalary #DataAnalysis
0:54
#DataAnalystSalary #DataAnalysis

56,782 views

2 years ago

Lore So What
skills to get hired in data #shorts

These are the top skills to get hired within the data space...

0:38
skills to get hired in data #shorts

509 views

3 years ago

Non-Linear Careers
Canva Tutorial: Create Data Viz with Canva sheets

... way to still create sting visualization for this um we're going to be using Statista on Canvas statista has a couple of free data set ...

2:22
Canva Tutorial: Create Data Viz with Canva sheets

222 views

9 months ago

Nelson Mbigili
Real-Time Sensor Data Visualization with p5.js and Arduino

In this video, I show how to read sensor data from an Arduino and visualize the results in real-time using P5.js The data is ...

0:58
Real-Time Sensor Data Visualization with p5.js and Arduino

40 views

1 year ago

Lore So What
types analytics explained with examples #shorts

These are the 3 types of analytics explained with practical examples...

0:55
types analytics explained with examples #shorts

459 views

3 years ago

Kim Enendu
How to Build a Standout Data Analyst Portfolio

Want to stand out as a data analyst? In this quick video, I'll show you how to create a portfolio that grabs attention and lands ...

1:32
How to Build a Standout Data Analyst Portfolio

57 views

1 year ago

Lore So What
Tableau vs Power BI - which one is better #shorts

Let's see which tool is better between Tableau and Power BI...

0:41
Tableau vs Power BI - which one is better #shorts

49,692 views

3 years ago