ViewTube

ViewTube
Sign inSign upSubscriptions
Filters

Upload date

Type

Duration

Sort by

Features

Reset

209 results

MICHELLE BANNON
Visualizing Data
7:03
Visualizing Data

54 views

10 months ago

The Data Girl
Import vs DirectQuery vs Live Connection in Power BI | CompleteGuide + Interview Questions Explained

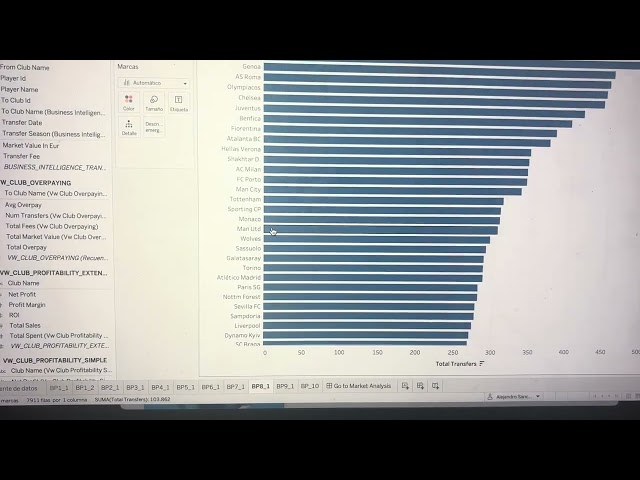
Power BI Import vs Direct Query vs Live Connection — Complete Guide with Examples & Interview Questions In this video, we ...

16:46
Import vs DirectQuery vs Live Connection in Power BI | CompleteGuide + Interview Questions Explained

821 views

3 months ago

Nicolas HEMAIN
Pivot Tables Made Easy: Turn Raw Data into Insights

Take a step forward on Excel : https://www.amazon.com/Excel-Formulas-PivotTables-Conditionnal-Formatting/dp/B0CG8F7TF9 ...

9:56
Pivot Tables Made Easy: Turn Raw Data into Insights

24 views

6 months ago

Pradnya
Power BI for Beginners: your first step into Data Visualisation.

Welcome to your first step into Data Visualization! In this beginner-friendly video, I'll walk you through what Power BI is, why it's ...

7:41
Power BI for Beginners: your first step into Data Visualisation.

31 views

8 months ago

Ale Sánchez
Business Intelligence Dashboard
8:11
Business Intelligence Dashboard

6 views

10 months ago

The Data Girl
Power BI Dashboard | Cafe Sales Data | End-to-End Data Analysis

Watch the full Playlist of Power BI - https://www.youtube.com/playlist?list=PL5MLDAaSK7WuU6s8ag-UwIKeC3ho0LTg5 Watch ...

25:38
Power BI Dashboard | Cafe Sales Data | End-to-End Data Analysis

787 views

1 month ago

DailyTech
🤖 Data Analysis with ChatGPT | Turn Raw Data into Insights Instantly

See how ChatGPT can analyze your data and generate insights in just minutes! In this video, I demonstrate how to: ✓ Upload ...

3:24
🤖 Data Analysis with ChatGPT | Turn Raw Data into Insights Instantly

71 views

6 months ago

Edwin Biju
1-12 Data Cleaning And Visualization

Data cleaning and visualization using python.

7:46
1-12 Data Cleaning And Visualization

1 view

2 months ago

Tommaso Lucentini - The Career Hacking Guy
How to Get a Job in Data with ZERO Experience in 2025! (Step by Step Guide)

Struggling to break into data with no experience? You're not alone! In this video, I'll walk you through EXACTLY how to land your ...

9:00
How to Get a Job in Data with ZERO Experience in 2025! (Step by Step Guide)

21 views

11 months ago

The Data Girl
Power Query Editor Interface Tour | Complete Beginner Guide | Power BI Data Cleaning Explained

Watch My Complete Playlists ▶️ Power BI Full Playlist: ...

11:13
Power Query Editor Interface Tour | Complete Beginner Guide | Power BI Data Cleaning Explained

147 views

3 months ago

The Data Girl
Power BI Amazon Dashboard | Product Ratings, Discounts & Category Analysis | End-to-End Project

... Used: Power BI Desktop Power Query DAX (Measures & Calculated Columns) Data Modeling Data Visualization Best Practices ...

28:52
Power BI Amazon Dashboard | Product Ratings, Discounts & Category Analysis | End-to-End Project

531 views

1 month ago

Nataliia Shevchenko
LaunchWise AI

LaunchWise AI | GenAI Capstone: One Chat to Validate Your Business Idea What if you could test your business idea — like ...

6:10
LaunchWise AI

24 views

10 months ago

Knock Out Data Insights
Power BI accessibility: making your reports inclusive for all!

Practical tips for making your Power BI reports accessible to everyone, including users with disabilities. After participating in the ...

24:05
Power BI accessibility: making your reports inclusive for all!

36 views

9 months ago

KingdomFruition
Posture and Visualization

Thee Arcadian voluntarily promotes Blayke Morales' book "I Am Great" BY WAY OF AMAZON.COM #ad #commissionsearned ...

13:49
Posture and Visualization

7 views

1 month ago

DailyTech
📊 Excel Data Analysis Tutorial | Sales Insights with Charts

Learn how to analyze sales data in Excel and create powerful insights using charts! In this video, I walk through: ✓ Organizing ...

3:04
📊 Excel Data Analysis Tutorial | Sales Insights with Charts

78 views

6 months ago

Digital Education, University of Edinburgh
About the Data course — Dr Janja Komljenovic

#dataproduction #datavisualization #data #datause #datagovernance #dataprivacy #ai #artificialintelligence.

2:19
About the Data course — Dr Janja Komljenovic

40 views

5 months ago

Zoe's AI&Automation Lab
AI-powered Data Processing & Visualization

Watch how AI changes the game in data analysis! #ai #worksmart #datascience #future #futureofwork.

8:14
AI-powered Data Processing & Visualization

3 views

9 months ago

Life with Blessing
I tried another Data Analytics Course | Challenging myself to study for 30 hours

In this video, I tried looking into a beginner Data Analytics Course I found to be helpful for beginners who want to know the basics ...

17:18
I tried another Data Analytics Course | Challenging myself to study for 30 hours

16 views

1 month ago

Ondigital
The Reporting System we Use For Clients Doing €1-50M

... We'll do all data collection + structure your data so that it becomes unified and makes sense – Data visualization + making your ...

8:08
The Reporting System we Use For Clients Doing €1-50M

86 views

3 months ago

Old School Chemistry
Basic Chemistry Math: ALEKS Constructing a scatter plot

Basic math to be successful in chemistry using the ALEKS chemistry platform… Learn to create scatter plots for visualizing ...

2:12
Basic Chemistry Math: ALEKS Constructing a scatter plot

61 views

6 months ago