Upload date
All time
Last hour
Today
This week
This month
This year
Type
All
Video
Channel
Playlist
Movie
Duration
Short (< 4 minutes)
Medium (4-20 minutes)
Long (> 20 minutes)
Sort by
Relevance
Rating
View count
Features
HD
Subtitles/CC
Creative Commons
3D
Live
4K
360°
VR180
HDR
1,660 results
... charts, analytics reporting and it makes my data look SO good. #dataanalytics #datavisualization #dataviz #infographics #graph ...
945 views
1 year ago
I left the bluetooth scanner running for 24 hours and can now try to create visualizations to make the data easy to digest.
344 views
3 years ago
Trying to get all the data that's on my boat into a clean easy spot to view and log. Here I show the new touchscreen from adafruit ...
287 views
2 years ago
https://www.anapaintsllc.com/physics-research-fellow-auc-data-science-initiative.
9 views
6 months ago
Prof Trish Gianakis Nov 2024 explains : Why Artists are Essential: Artists make complex data accessible, compelling, and ...
15 views
This is CS50, Harvard University's introduction to the intellectual enterprises of computer science and the art of programming.
57,969 views
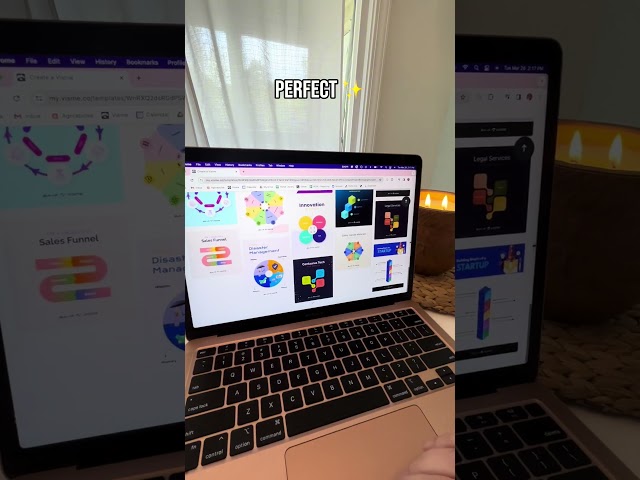
Choosing the best visualization for your data is not always the easiest. Here are 5 tips on what charts to use and when ...
663 views
10 months ago
These are my 4 tips to visualise your data that I learned on the the way...
696 views
Katie Ledecky may just be the GOAT. We explain why the 1500m race is so brutal and how dominant Katie really is.
1,060 views
2 views
In this video, I show how to read sensor data from an Arduino and visualize the results in real-time using P5.js The data is ...
40 views
Let your data speak volumes with our expert touch. #DataGenomix #DataVisualization #DataDriven #DigitalMarketing.
28 views
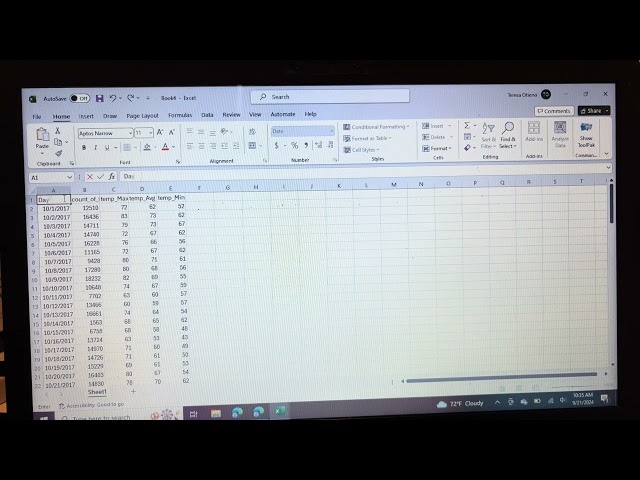
Using Excel to combine two datasets and perform data visualization.
6 views
Love Data Week is February 10th to the 14th. To celebrate, the Chester Fritz Library and the School of Medicine and Health ...
21 views
54 views
From health data to tourism trends and beyond, every episode in this series is crafted to help you understand, analyse, and ...
1 view
7 months ago
3 views
Multi-omics Integrated Genomap: An Enhanced Approach For Visualization In Single Cell Data.
35 views
Drowning in data but struggling to make it tell a story? See how Generative AI transforms complex data into clear, compelling ...
200 views
9 months ago
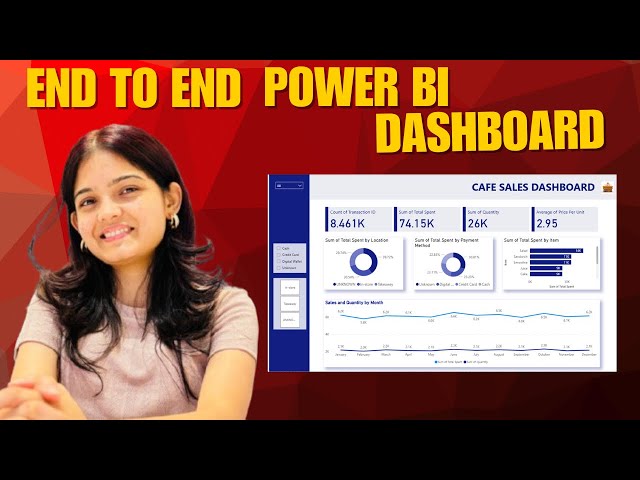
... data analytics project, Power BI tutorial, Power BI beginner project, sales dashboard Power BI, Power BI data visualization, cafe ...
765 views
1 month ago