Upload date
All time
Last hour
Today
This week
This month
This year
Type
All
Video
Channel
Playlist
Movie
Duration
Short (< 4 minutes)
Medium (4-20 minutes)
Long (> 20 minutes)
Sort by
Relevance
Rating
View count
Features
HD
Subtitles/CC
Creative Commons
3D
Live
4K
360°
VR180
HDR
739 results
In this video you will Learn how to build your data visualization skill, How to data Visualize Professionally. #datavisualization ...
45 views
1 month ago
Transform complex financial data into clear, compelling visuals. In this tutorial, we show you how to use S&P Capital IQ Pro's ...
141 views
2 weeks ago
... Building reports that answer real questions 02:45-04:03 — The importance of data quality 04:04-05:24 — Data visualization as ...
753 views
10 days ago
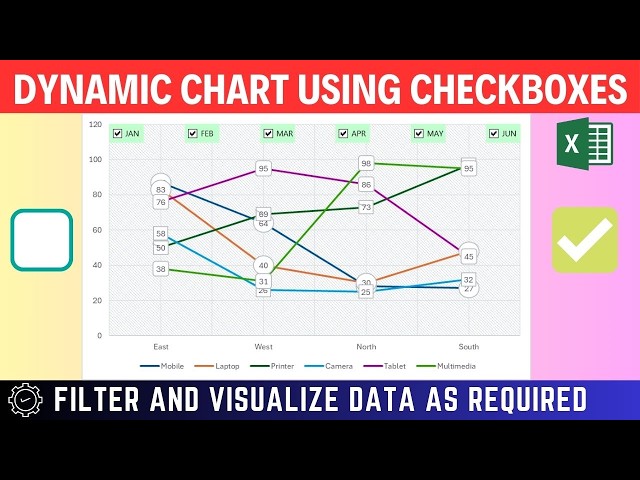
Learn how to create a Dynamic Checkbox Chart in Excel that lets you filter and visualize data instantly. In this step-by-step Excel ...
73 views
5 days ago
Ready to build your first interactive dashboard? In this tutorial, I'll show you how to go from raw data to a stunning, modern ...
32 views
12 days ago
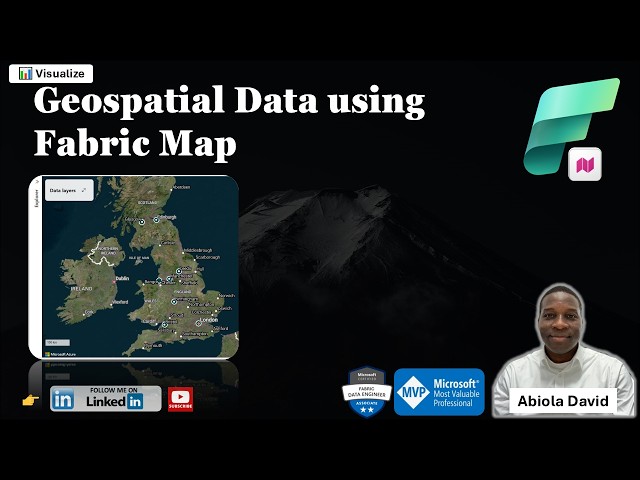
One of the exciting additions to Microsoft Fabric is the Map Item which enables teams to visualize and analyze geospatial data ...
117 views
... to Data Analytics ✓ Data Analytics Career Roadmap ✓ Data Analysis with Excel ✓ SQL for Data Analysis ✓ Data Visualization ...
2,222 views
Learn how to build professional, interactive Tableau dashboards from scratch in Tableau Session 4. In this video, you'll master the ...
304 views
This video is sponsored by Fabi. Try Fabi here: https://www.fabi.ai/?via=nocodemba Fabi reached out to sponsor this video, and I ...
303 views
3 weeks ago
Use Jupyter Notebooks to query, enrich and create visualizations directly within the notebook environment. To learn more about ...
70 views
Can data science actually improve mental health? In this video, I use data visualization and EDA to uncover hidden patterns in ...
13 views
Master Microsoft Excel from absolute zero! This is your full beginner tutorial to master spreadsheets. Forget the overwhelm, we'll ...
251 views
Download the free PostHog Implementation Tracking Plan → https://tinyurl.com/29dyzvk9?utm_content=163 This PostHog tutorial ...
266 views
... exercise: https://community.storytellingwithdata.com/exercises/tame-a-text-heavy-slide IMPROVE YOUR DATA VISUALIZATION ...
1,319 views
Data quality failures are an unavoidable fact of life for data engineers, but the time spent debugging them doesn't have to be.
214 views
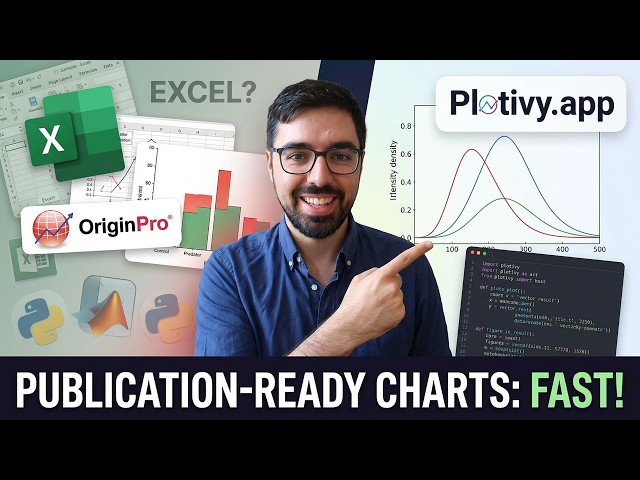
RELATED RESOURCES • Plotivy blog — data visualization best practices for researchers: https://plotivy.app/blog • Chart types ...
10 views
7 days ago
... Data Effectively https://amzn.to/3NxEwvW Effective Data Visualization https://amzn.to/49Kz4P7 FAQs I'm using Microsoft 365 ...
3,856 views
WACV 2026 Poster Presentation SilverLining: Data-First Mitigation of Spatial and Spectral Shortcuts Without Introducing New ...
0 views
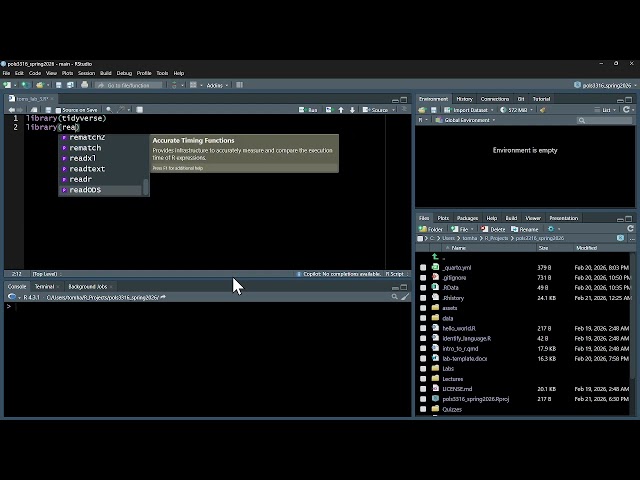
POLS 3316: Statistics for Political Scientists Lab 3 Part 1: Data Loading and Visualization In this opening for Lab 3, we load some ...
120 views
This video shows you how to connect a SharePoint list to a Power Bi using the SharePoint Online list connector.
53 views
8 days ago


![How to Add Data Labels to Bar Charts in PowerPoint 🔥 [PPT TIPS]](/api/proxy/image?url=https%3A%2F%2Fi.ytimg.com%2Fvi%2Fz17fyk8SEHA%2Fsddefault.jpg)