Upload date
All time
Last hour
Today
This week
This month
This year
Type
All
Video
Channel
Playlist
Movie
Duration
Short (< 4 minutes)
Medium (4-20 minutes)
Long (> 20 minutes)
Sort by
Relevance
Rating
View count
Features
HD
Subtitles/CC
Creative Commons
3D
Live
4K
360°
VR180
HDR
13,765 results
To learn for free on Brilliant, go to https://brilliant.org/techwithtim . Brilliant's also given our viewers 20% off an annual Premium ...
7,461 views
11 days ago
Visualization is central to the process of how we think. This video reviews the inner workings of Python's most popular plotting ...
3,806 views
5 years ago
In this video Rob, a Kaggle Grandmaster, quickly and humorously walks through each of the popular plotting and data ...
109,135 views
4 years ago
Learn to plot graphs in Python in this tutorial! We cover matplotlib and show you how to get an awesome looking plot. As part of ...
56,196 views
In this video course, learn about Python Matplotlib and its concepts. Matplotlib is an open-source plotting library. Create interactive ...
37,757 views
2 years ago
Learn Data Analysis with Python in this comprehensive tutorial for beginners, with exercises included! NOTE: Check description ...
4,025,272 views
Master AI from Zero to Advanced: https://ailearninghub.io ------------------------- In this video, you'll learn how to create and customize ...
181 views
10 months ago
Matplotlib shortcut every Python programmer and Data Scientist needs to know! Learn how to effortlessly style your plots with ...
500 views
1 year ago
Matplotlib Python Tutorial for Beginners | Data Visualization in Python Matplotlib is a python library used for data ...
5,907 views
7 days ago
Welcome to a Matplotlib with Python 3+ tutorial series. In this series, we're going to be covering most aspects to the Matplotlib data ...
700,613 views
10 years ago
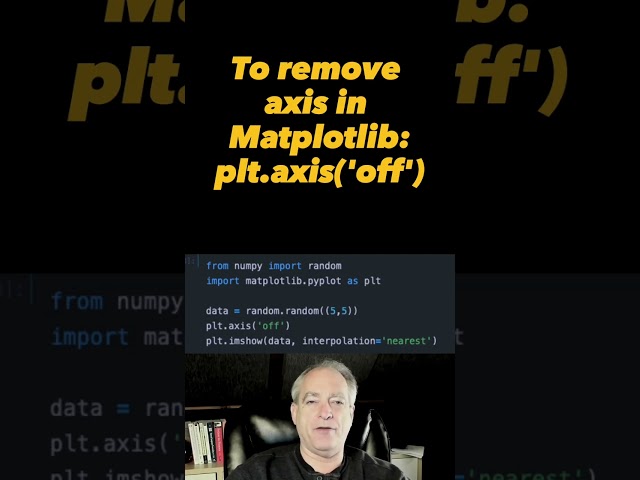
In this super short video, I show you how to remove the axis when plotting in Matplotlib. Useful for when your are plotting image ...
322 views
In this lesson, learn what is Matplotlib with its features. Matplotlib is an open-source plotting library developed by John D. Hunter.
24,423 views
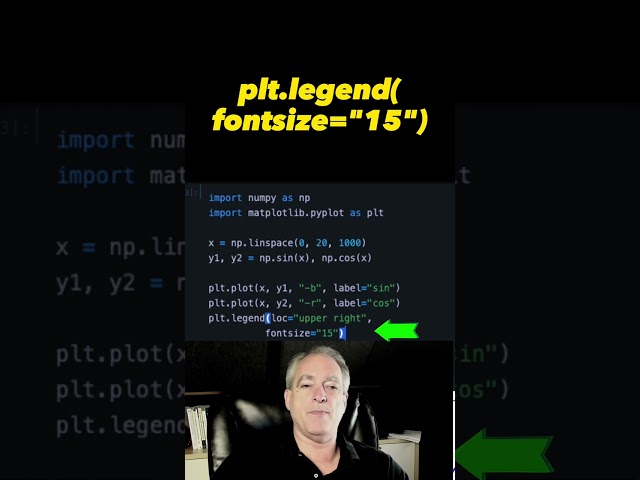
This video will show you how to control the Matplotlib legend size by controlling the font size used in the legend.
519 views
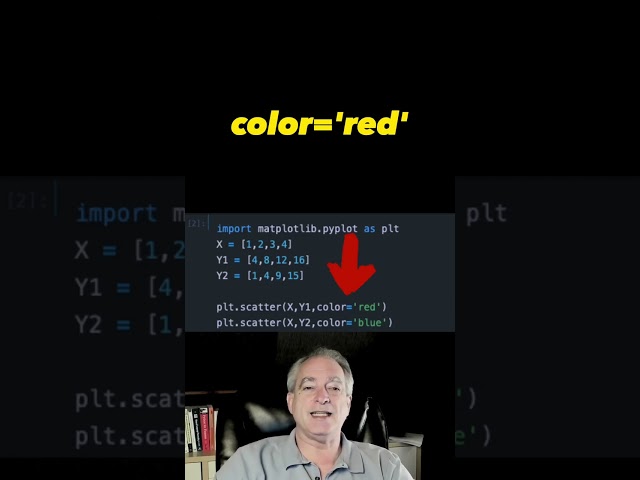
This video will show how to control what color each plot is when using Matplotlib.
520 views
This video shows how to install matplotlib on Python 3.14.2 It will walk you through, step-by-step, how to install matplotlib on ...
155 views
1 month ago
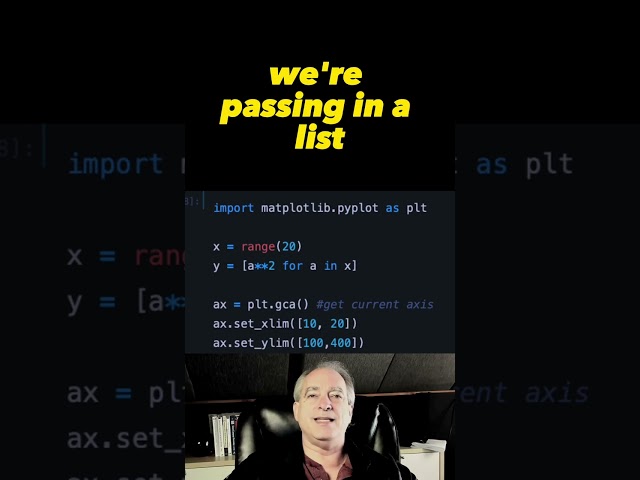
In order to control what range is shown on your Matplotlib plot, you have to grab the current axes using plt.gca(). Then use this ...
343 views
3 years ago
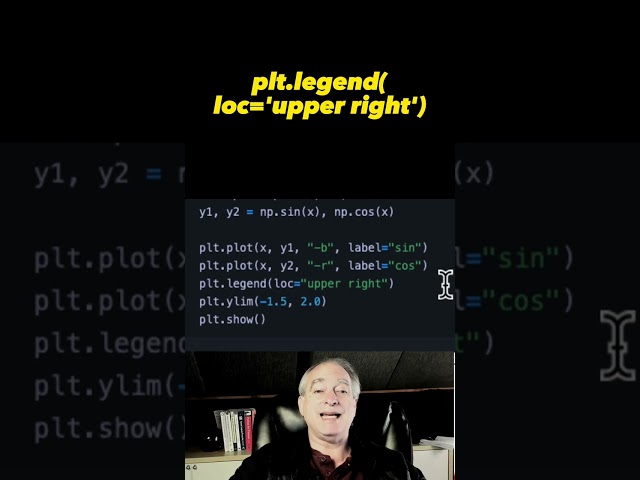
In this quick video, we'll show you how to add a legend to a Matplotlib plot. This is a quick and easy way to improve the ...
246 views
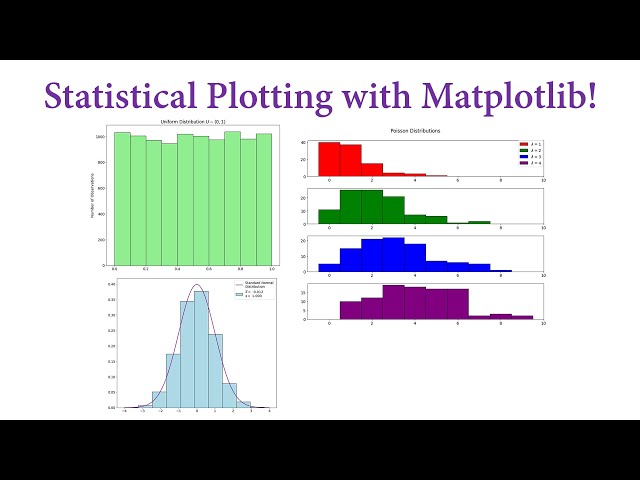
A tutorial illustrating how to generate random samples from various distributions, how to plot the samples in a histogram and how ...
1,145 views
Intro to Data Analysis Visualization with Python, Matplotlib and Pandas: Introduction and Overview: Time series and forecasting ...
6,340 views
Python offers several powerful libraries for data visualization. This is a detailed comparison of them: Matplotlib vs Seaborn vs ...
312 views
8 months ago
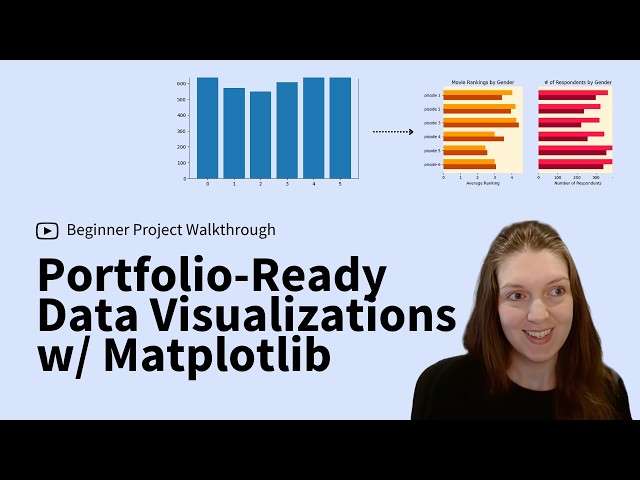
In this video, Dataquest's Director of Curriculum, Anna Strahl, will guide you through how to clean and analyze real survey data ...
1,189 views
6 months ago
Sebastian's books: https://sebastianraschka.com/books/ In this video, I am showing you how to use my favorite plotting library to ...
3,636 views
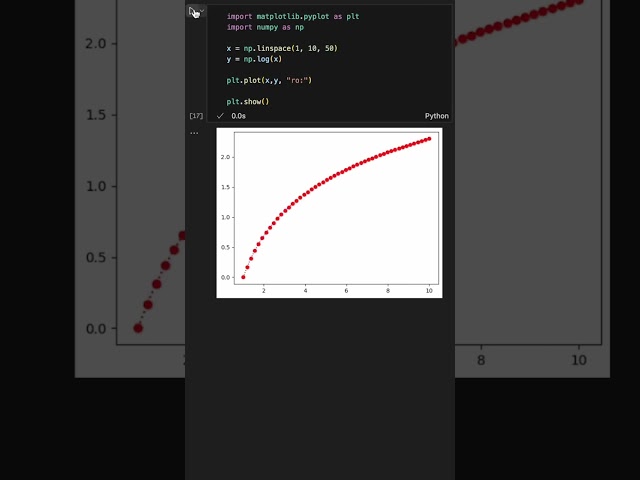
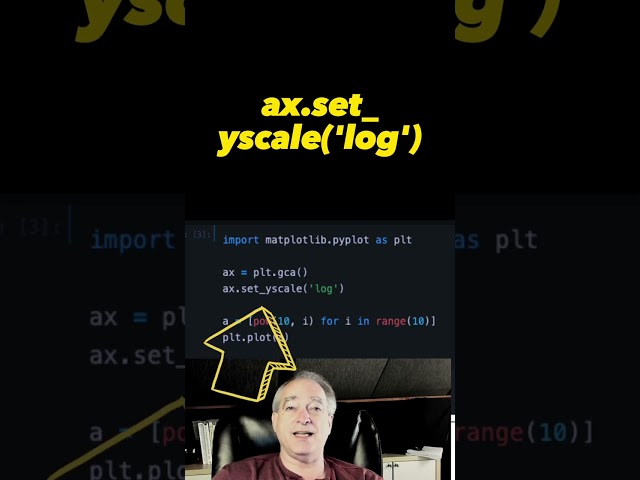
In this short video, I show you how to create a plot on a logarithmic axis in Matplotlib. You can grab the current axis with plt.gca().
507 views
Organized by textbook: https://learncheme.com/ 21st screencast of a series on Python. Made by faculty at the New Jersey Institute ...
1,066 views
The figure is the overall size that all subplots are drawn on. You can pass in figsize parameter when creating subplots to control ...
869 views