ViewTube

ViewTube
Sign inSign upSubscriptions
Filters

Upload date

Type

Duration

Sort by

Features

Reset

635 results

Alex Demko
STOP Using MATPLOTLIB Alone! Here's What Happens When You Add PANDAS

Get ready for a shocking combination! In this video, we'll reveal the power of combining Matplotlib and Pandas in Jupyter ...

8:10
STOP Using MATPLOTLIB Alone! Here's What Happens When You Add PANDAS

82 views

1 year ago

Aalto Scientific Computing
2.3 Visualizaiton - Python for Scientific Computing 2023

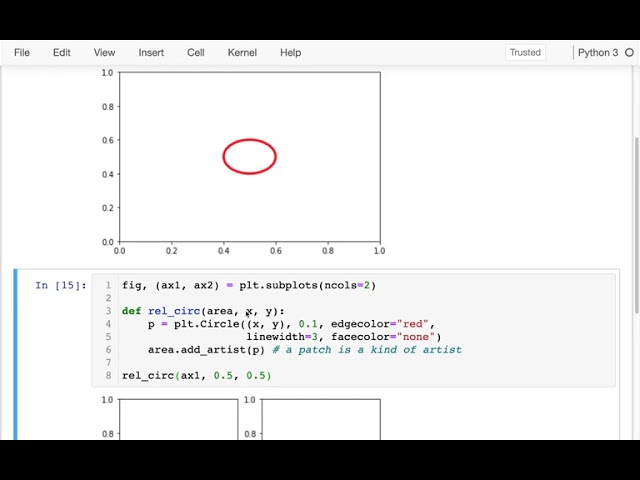
Generating figures is part of the scientific process. This should not be manual, but ideally they should be automatically generated ...

46:58
2.3 Visualizaiton - Python for Scientific Computing 2023

139 views

2 years ago

BioniChaos
Data Extraction from Chart using Matplotlib and Numpy

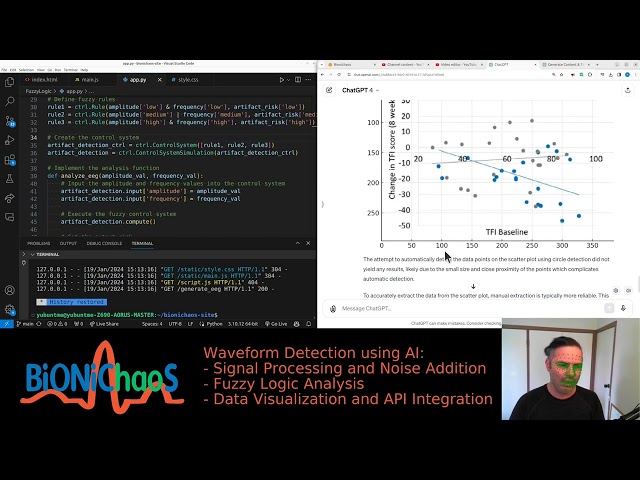
In this video, I share my experience with GPT-4 extracting data from a challenging paper. I attempted to use Matplotlib and Numpy ...

0:45
Data Extraction from Chart using Matplotlib and Numpy

96 views

1 year ago

Tyler Caraza-Harter
CS 320 Oct 28 (Part 1) - Matplotlib Coordinate Systems

... one of these tools um let me give you an example of that maybe something that wouldn't be so easy to do in matplotlib um here i ...

22:13
CS 320 Oct 28 (Part 1) - Matplotlib Coordinate Systems

396 views

5 years ago

Berkeley Institute for Data Science (BIDS)
How We Designed Matplotlib's New Default Colormap (and You Can Too)

BIDS Data Science Lecture Series | September 4, 2015 | 1:00-2:30 p.m. | 190 Doe Library, UC Berkeley Speaker: Nathaniel Smith, ...

1:01:33
How We Designed Matplotlib's New Default Colormap (and You Can Too)

1,941 views

Streamed 10 years ago

Data Analytics& Science
3. Data Visualization

This tutorial delves into the foundational tools (e.g., Matplotlib, Seaborn, Pandas)for data visualization in Python. We'll explore bar ...

16:01
3. Data Visualization

599 views

2 years ago

Aalto Scientific Computing
3.6 Outro of day 3 - Python for Scientific Computing 2023

Outro of day 3 - general discussion about the course. 00:00 Q&A and summary of the day: why did we do this? ----- Python for ...

9:31
3.6 Outro of day 3 - Python for Scientific Computing 2023

46 views

2 years ago

Aalto Scientific Computing
2.4 Data formats - Python for Scientific Computing 2023

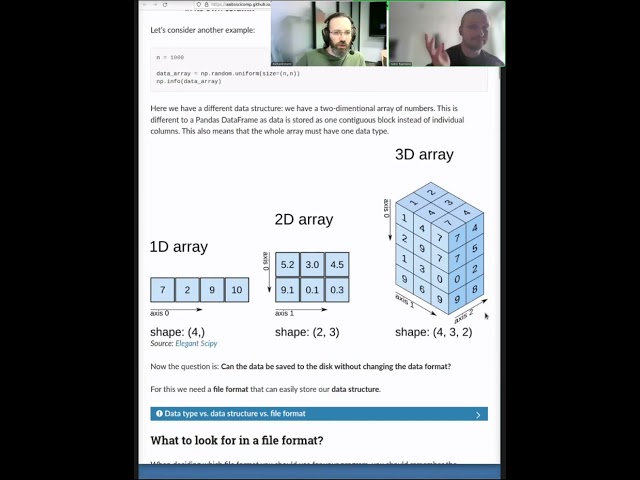
Input/output bandwidth is just as much a consumable resource as CPU or memory. And data formats are important for both ease ...

10:34
2.4 Data formats - Python for Scientific Computing 2023

113 views

2 years ago

Aalto Scientific Computing
4.6 Outro - Python for Scientific Computing 2023

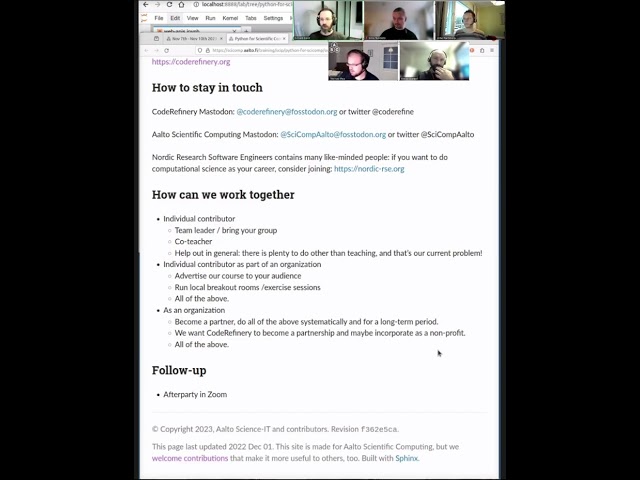
The conclusion of the workshop, looking at feedback, some final discussion. ----- Python for Scientific Computing is a bridge ...

7:19
4.6 Outro - Python for Scientific Computing 2023

46 views

2 years ago

xvzf
I roasted a YouTube Data Scientist | Missing Data

This video is about missing data. Missing data is sneaky. In time series settings it is important to impute these values, but you can't ...

5:19
I roasted a YouTube Data Scientist | Missing Data

838 views

3 years ago

Japan Nature Short Films, harum k
Inertia and Surface tension! only 24steps of python program

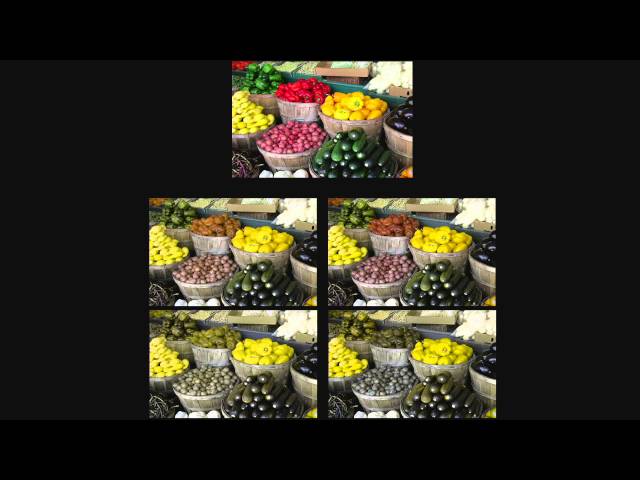
This program simulates inertia and surface tension. I made this program in the early 2000s, it was a java applet. I made this ...

1:10
Inertia and Surface tension! only 24steps of python program

58 views

4 years ago

Tech With Pro
AUTOMATE STUNNING 👌 REPORTS from CSV with PYTHON & MATPLOTLIB 👌 PYTHON 'DOCXTPL'  TUTORIAL 👍

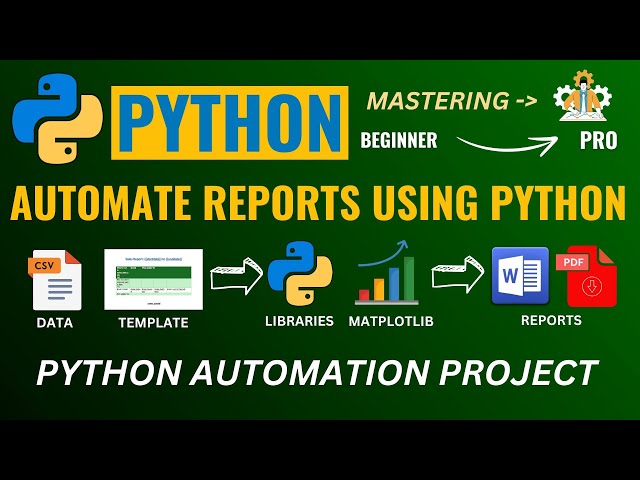
Automating Reports from CSV using Python libraries ('docxtpl', 'docx2pdf') and 'Matplotlib'. Python 'docxtpl' and 'docx2pdf' ...

28:18
AUTOMATE STUNNING 👌 REPORTS from CSV with PYTHON & MATPLOTLIB 👌 PYTHON 'DOCXTPL' TUTORIAL 👍

547 views

1 year ago

CodeRefinery
6.3 Modular Code Development - CodeRefinery 2024 Mar

In this live-coding demo session we take a Python script as starting point which reads data, computes simple statistics, and ...

1:19:22
6.3 Modular Code Development - CodeRefinery 2024 Mar

86 views

1 year ago

Matthew Curinga (mxc)
Sequential, divergent, and categorical colormaps in python

This videos is for week 4 of Intro to Programming at Adelphi University 2024. We look at plotting US Census data for large cities in ...

1:09:39
Sequential, divergent, and categorical colormaps in python

206 views

1 year ago

Danny Heap
racket aggregates video 2.9/6 --- maps

Video from http://www.cdf.toronto.edu/~heap/racket_lectures.html on using map to transform list elements to create a new list.

3:17
racket aggregates video 2.9/6 --- maps

1,780 views

12 years ago

Hans van der Kwast
Use Jupyter Lab in your QGIS Python Environment

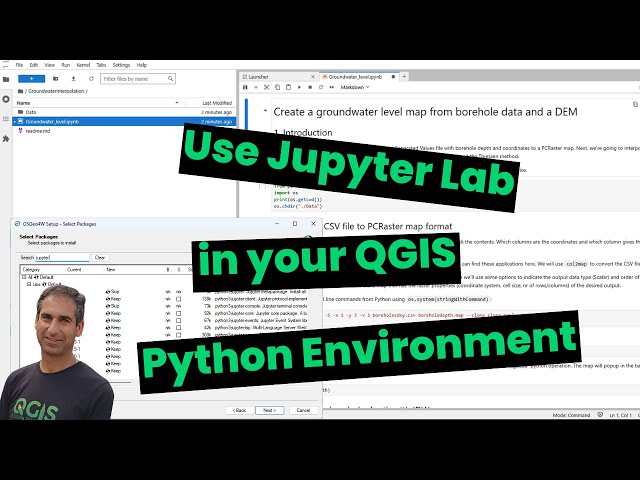
This video demonstrates a simple way of running Jupyter Notebooks in your QGIS Python Environment on Windows. We only ...

2:50
Use Jupyter Lab in your QGIS Python Environment

1,969 views

10 months ago

NPTEL IIT Bombay
Tutorial 04 Part 01: Plotting In 1 D Using Python

Week 4: Tutorial 04 Part 01: Plotting In 1 D Using Python.

28:22
Tutorial 04 Part 01: Plotting In 1 D Using Python

1,173 views

3 years ago

Coding Nexus
Linear Regression for Machine Learning | Python Tutorial

Create and Finetune a Chatbot FREE without coding Query AI - https://queryai.co.uk/?ref=lsmhtpxd Join in this comprehensive ...

10:28
Linear Regression for Machine Learning | Python Tutorial

396 views

1 year ago

BioniChaos
Train Machine Learning Models with Confusion Matrices & Data Visualization Using Python and Plotly

In this video, I walk through the process of training a machine learning model using Python, specifically focusing on generating a ...

13:47
Train Machine Learning Models with Confusion Matrices & Data Visualization Using Python and Plotly

81 views

1 year ago

CodeRefinery
6.2 Modular Code Development - CodeRefinery 2024 Sep

In this live-coding demo session we take a Python script as starting point which reads data, computes simple statistics, and ...

1:10:41
6.2 Modular Code Development - CodeRefinery 2024 Sep

49 views

1 year ago

Aalto Scientific Computing
4.5 Panel discussion - Python for Scientific Computing 2023

At the end of the course, we had a general panel discussion/Q&A session with all of these instructions. We discuss many ...

22:32
4.5 Panel discussion - Python for Scientific Computing 2023

50 views

2 years ago

New Mexico EPSCoR
Python Fundamentals with Data Analysis and Visualization

Python is a high-level programming language that is leveraged in a wide range of disciplines and fields. This webinar training ...

47:21
Python Fundamentals with Data Analysis and Visualization

139 views

4 years ago

Micro Rishi
Data Visualization | Car Evaluation Dataset | Part 4

Hi everyone, welcome back to our channel. In this video, We're going to show how to view count plot for the data, and profiling the ...

6:59
Data Visualization | Car Evaluation Dataset | Part 4

325 views

2 years ago

CodeRefinery
6.2 Modular Code Development - CodeRefinery 2025 Mar

In this live-coding demo session we take a Python script as starting point which reads data, computes simple statistics, and ...

1:25:25
6.2 Modular Code Development - CodeRefinery 2025 Mar

57 views

9 months ago

Aalto Scientific Computing
3.3 Libraries - Python for Scientific Computing 2023

Your code doesn't exist alone. It is one part of a large ecosystem, where many other things exist for you to build off of. This is ...

17:49
3.3 Libraries - Python for Scientific Computing 2023

91 views

2 years ago