Upload date
All time
Last hour
Today
This week
This month
This year
Type
All
Video
Channel
Playlist
Movie
Duration
Short (< 4 minutes)
Medium (4-20 minutes)
Long (> 20 minutes)
Sort by
Relevance
Rating
View count
Features
HD
Subtitles/CC
Creative Commons
3D
Live
4K
360°
VR180
HDR
498 results
If you're still using console.log() to find and fix JavaScript issues, you might be spending more time debugging than you need to.
903,510 views
8 years ago
Discover 5 different ways to debug your code beyond console.log - Discover the breakpoints, debugger statements, logpoints, ...
44,225 views
2 years ago
Learn how to use the most popular Chrome DevTools features related to inspecting network activity, including: 1:05 - View a ...
398,937 views
6 years ago
In this episode, Bramus and Jecelyn walk you through the different ways of logging and filtering messages in the Console.
80,061 views
3 years ago
Test UI changes and production fixes with the powerful network response overrides in Chrome DevTools. Learn to override and ...
14,181 views
1 year ago
Learn how to use the Performance insights panel to get actionable and use-case-driven insights on your website's performance.
53,521 views
Have you ever applied CSS to an element but it just doesn't work? In this episode, Jecelyn and Sofia show us how to discover ...
14,114 views
Developers use frameworks, multiple languages, and libraries to build their web applications. Browsers only see the resulting ...
10,694 views
Whether you're an experienced programmer or you don't write code at all, you can learn to check your site performance with ...
34,745 views
To watch this keynote interpreted in American Sign Language (ASL), please click here → https://goo.gle/3LYclAp Learn how new ...
30,712 views
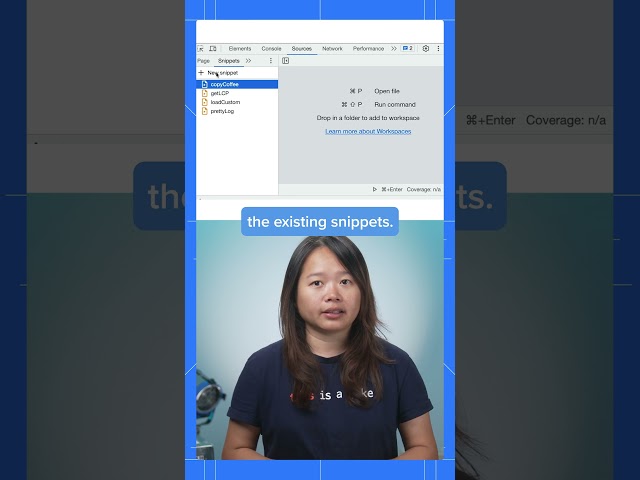
Watch the full video → https://goo.gle/45Wfdrr Catch more videos → https://goo.gle/DevToolsTips Subscribe to Google Chrome ...
6,044 views
With Chrome 60, you can now measure time to first paint and time to first contentful paint with the Paint Timings API. You can ...
29,916 views
Fed up with wading through browser messages in the console? The Chrome DevTools Issues Panel provides a more structured, ...
42,058 views
5 years ago
Explore localStorage and sessionStorage with Jecelyn! The localStorage and sessionStorage APIs allow you to store data on a ...
45,935 views
Let's take a look at the latest and greatest features in Chrome's DevTools. We cover how you can use the Performance Panel to ...
12,575 views
Web Assembly (WASM) is a binary file with its own format, in which you can turn any programming language, such as C and C++, ...
9,362 views
7 years ago
Build interactive, engaging web interfaces with CSS anchor positioning and popover elements. Create tooltips, hover cards, ...
4,835,828 views
New to DevTools in Chrome 80: 0:09 - Support for let and class redeclarations 0:40 - Improved WebAssembly debugging 0:54 ...
78,039 views
In this hands-on talk, we cover tips & tricks for optimizing your user-experience to meet the Core Web Vitals. We use tools like ...
188,571 views
Chrome has a mechanism for turning on or turning off a feature for a subset of users. This video explains how and why. Chapters: ...
11,498 views
New to DevTools in Chrome 72: 0:08 → Performance metrics in the Timings section 1:13 → Highlight text nodes 1:29 → Copy JS ...
69,235 views
Latest from Chrome → https://goo.gle/3XZodJu Catch more DevTools Tips → https://goo.gle/DevToolsTips Subscribe to Google ...
8,686 views
Developing enterprise applications can often come with unique challenges. Enterprise customers have requirements around ...
1,177 views
New to DevTools in Chrome 88: What's new in DevTools (Chrome 88) → http://goo.gle/3owkBMr CSS Angle documentation ...
88,332 views
Diagnosing common JavaScript SEO issues and helpful steps to debug them! Resources: Understand the JavaScript SEO basics ...
13,089 views