Upload date
All time
Last hour
Today
This week
This month
This year
Type
All
Video
Channel
Playlist
Movie
Duration
Short (< 4 minutes)
Medium (4-20 minutes)
Long (> 20 minutes)
Sort by
Relevance
Rating
View count
Features
HD
Subtitles/CC
Creative Commons
3D
Live
4K
360°
VR180
HDR
27 results
Barry joins Jecelyn again to explain how to record a trace in the Performance panel and debug LCP and CLS issues using the ...
31,196 views
1 year ago
Performance debugging just got a whole lot easier. Learn how our new Chrome DevTools Performance panel is more accessible ...
18,958 views
8 months ago
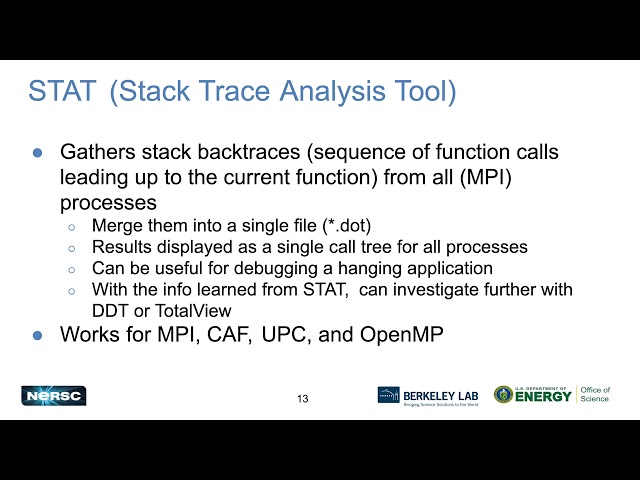
Part of the NERSC New User Training on June 16, 2020. Please see ...
202 views
5 years ago
In part 3 of our multi-part series on performance profiling, PM Esteban Herrera shows us how to profile apps once they are in ...
9,842 views
Jake and Surma tackle one of the hardest types of debugging on the web: Memory leaks. Some links mentioned: Squoosh ...
51,466 views
4 years ago
If you're still using console.log() to find and fix JavaScript issues, you might be spending more time debugging than you need to.
903,535 views
8 years ago
Week 7: Lecture 33: Performance profiling and optimization.
1,046 views
3 years ago
Developers use frameworks, multiple languages, and libraries to build their web applications. Browsers only see the resulting ...
10,694 views
2 years ago
Learn how to use the Performance insights panel to get actionable and use-case-driven insights on your website's performance.
53,521 views
Learn how the Web Vitals initiative gives developers the metrics, tools, and guidance they need to deliver a great experience for ...
26,622 views
We implement a Wordle solver in Rust based off on the excellent 3blue1brown video on the same topic: ...
162,590 views
Discover 5 different ways to debug your code beyond console.log - Discover the breakpoints, debugger statements, logpoints, ...
44,230 views
Performance is measured from the ground truth of the browser internals, and you're operating a few levels up, with the DOM, ...
7,433 views
10 years ago
This tutorial shows you how to use Chrome DevTools to find ways to make your pages load faster. Using Tony the Cat's site, ...
334,238 views
7 years ago
In this stream, we started porting parts of the flamegraph profiling tool to Rust: http://www.brendangregg.com/flamegraphs.html.
52,569 views
A whirlwind tour of new features and proposals to improve the performance of your pages. Thank you for visiting this, the ...
31,122 views
Let's take a look at the latest and greatest features in Chrome's DevTools. We cover how you can use the Performance Panel to ...
12,575 views
In this episode, Jake and Surma discuss the array function reduce(). Is it good to use it? Is it too “smart”? Does it increase or ...
79,090 views
6 years ago
Learn how to audit what's in your JavaScript bundles that could use some trimming using tools like Source Map Explorer in a new ...
42,203 views
9 years ago
Link to podcast → https://goo.gle/3L1qSgo In this episode we're shifting the topic to layout shift, that moment where you watch the ...
5,919 views