Upload date
All time
Last hour
Today
This week
This month
This year
Type
All
Video
Channel
Playlist
Movie
Duration
Short (< 4 minutes)
Medium (4-20 minutes)
Long (> 20 minutes)
Sort by
Relevance
Rating
View count
Features
HD
Subtitles/CC
Creative Commons
3D
Live
4K
360°
VR180
HDR
218,706 results
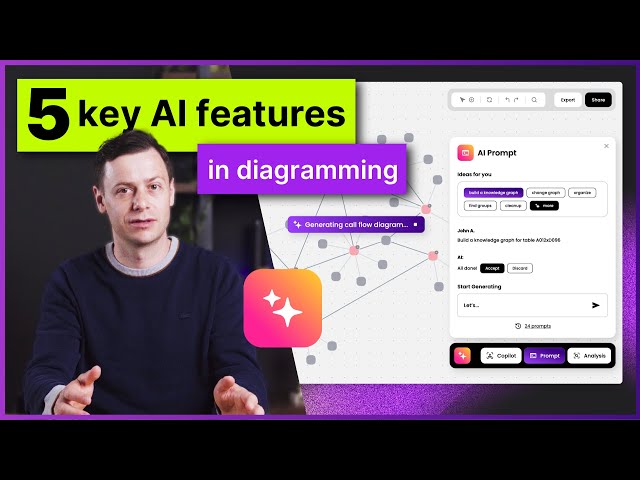
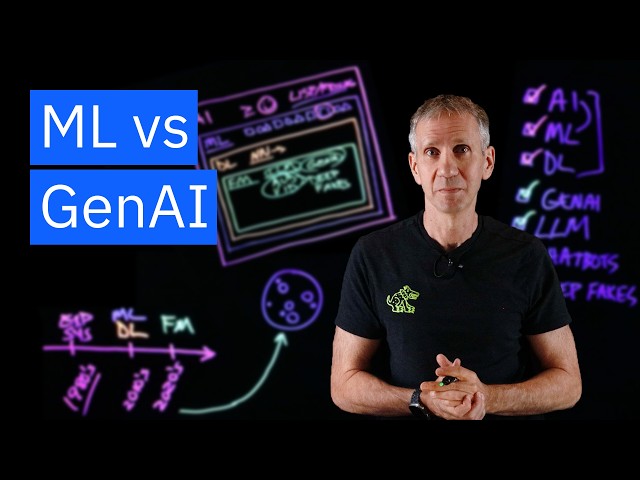
Discover how AI revolutionizes how we create and interact with diagrams, making complex processes simpler and faster. Whether ...
17,516 views
9 months ago
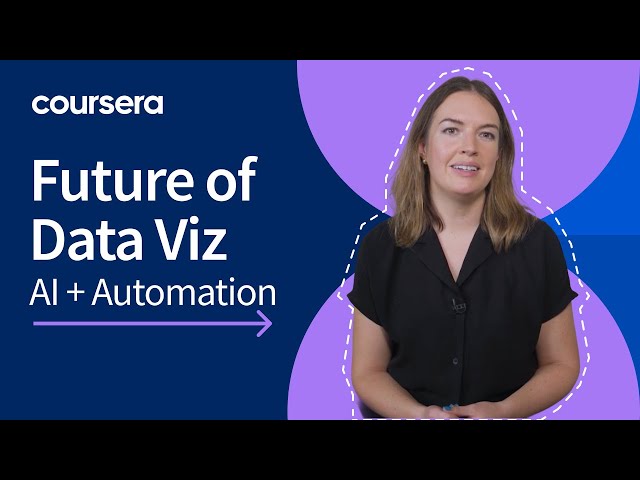
Discover how AI and automation are revolutionizing data visualization! Learn about the latest trends that are transforming how we ...
1,238 views
7 months ago
Check out https://g.co/aiexperiments to learn more. This experiment helps visualize what's happening in machine learning.
1,306,623 views
9 years ago
Have you ever wondered how social media platforms seem to know you so well? Well, It involves the same mechanism scientists ...
514,631 views
1 year ago
Ready to become a certified watsonx Data Lakehouse Engineer? Register now and use code IBMTechYT20 for 20% off of your ...
22,100 views
3 months ago
Forget about ChatGPT! This AI tool can create dashboards and much more. Power BI course: https://bit.ly/claudeai24course ...
242,273 views
Copilot for Power BI takes the guesswork out of data analysis, helping you uncover trends, generate reports, and ask natural ...
6,200 views
Today I'll walk you through Quadratic, the most advanced AI Spreadsheet tool available today. Get Started with Quadratic ...
29,448 views
10 months ago
Join Patrick LeBlanc and Phil Seamark on this episode of Fabric Tech Talk Fridays as they explore how AI and language models ...
4,441 views
1 month ago
try out Freepik, your AI creative studio! https://www.freepik.com/ My Online Course [5000+ Students Enrolled, 4.9 rating] My ...
15,450 views
2 months ago
try out Framer today! https://www.framer.com/ My Online Courses [New!] Master Workplace Skills and Leadership (ft. Senior ...
249,108 views
Want to learn more about Agentic AI + Data? Register here → https://ibm.biz/BdeGLe Want to play with the technology yourself?
2,905,055 views
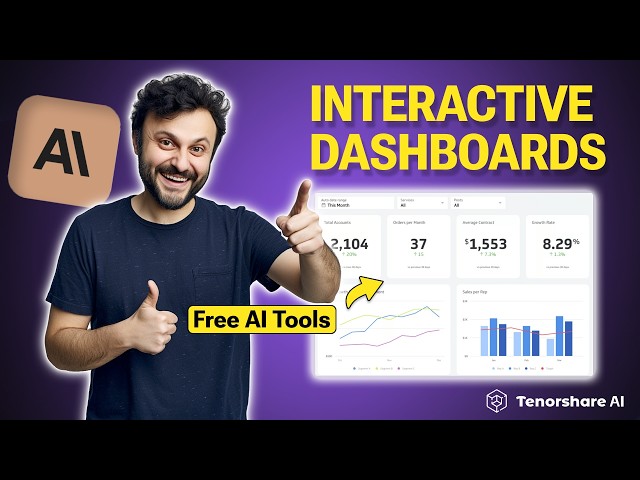
Learn more about Tenorshare AI: https://bit.ly/3XLMvIR Today, I'm excited to show you how I used Claude 3.5 Sonnet to create an ...
8,029 views
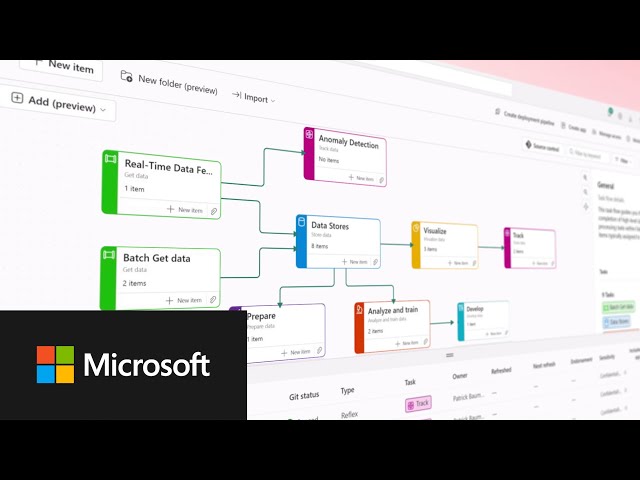
With Microsoft Fabric, you can give your teams the AI-powered tools needed for any data project in a pre-integrated and optimized ...
120,268 views
In this video Rob, a Kaggle Grandmaster, quickly and humorously walks through each of the popular plotting and data ...
110,349 views
4 years ago
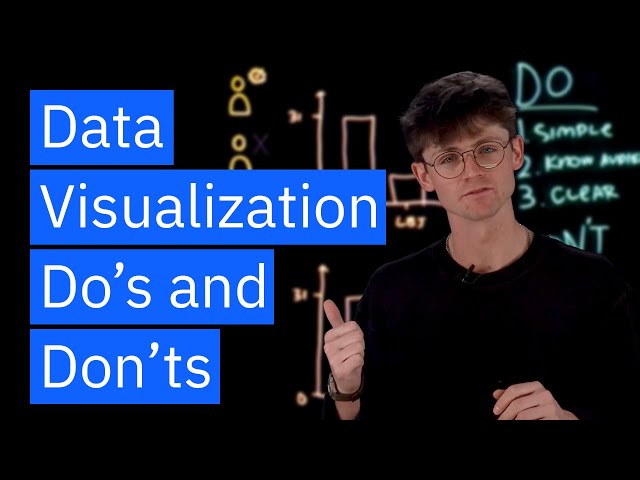
Are you tired of spending hours designing dashboards that confuse your team and waste your time? In this video, I reveal the best ...
407 views
6 months ago
In this step-by-step tutorial, we'll create a powerful, interactive dashboard using Bricks, an AI-powered spreadsheet and ...
61,325 views
Subscribe to our newsletter: https://dataneighbor.substack.com/ DNP Swag Store: https://shop.dataneighbor.com/ Check out Hex: ...
1,157 views
4 months ago
Diffusion models, CLIP, and the math of turning text into images Welch Labs Book: ...
1,694,230 views
Ready to become a certified Cognos Analytics v12 Analyst? Register now and use code IBMTechYT20 for 20% off of your exam ...
12,904 views
11 months ago