Upload date
All time
Last hour
Today
This week
This month
This year
Type
All
Video
Channel
Playlist
Movie
Duration
Short (< 4 minutes)
Medium (4-20 minutes)
Long (> 20 minutes)
Sort by
Relevance
Rating
View count
Features
HD
Subtitles/CC
Creative Commons
3D
Live
4K
360°
VR180
HDR
9,156 results
Ana Bell explains “rubber duck debugging," a technique in which a programmer explains their code to an inanimate object in ...
19,092 views
10 months ago
Meet the Scrutiny Debugger! 🛠️ Pier-Yves Lessard joins The IoT Show to demonstrate his open-source tool that is changing ...
6,199 views
2 months ago
I Stopped Manual Debugging (Here's Why) Hey everyone and welcome back! This video explores how to use modern "ai tools" ...
255 views
5 months ago
Evaluate your ADK Agents → https://goo.gle/3EID0TM Evaluate Gen AI agents | Generative AI on Vertex AI ...
10,921 views
11 months ago
When something goes wrong in traditional software, you know what to do: check the error logs, look at the stack trace, find the line ...
9,156 views
1 month ago
The Playwright MCP server helps Copilot do more than just run tests. It can confirm and resolve bugs too. In this demo, we've ...
41,807 views
7 months ago
Discover AWS Lambda's groundbreaking remote debugging capability, allowing developers to debug functions deployed in AWS ...
737 views
3 months ago
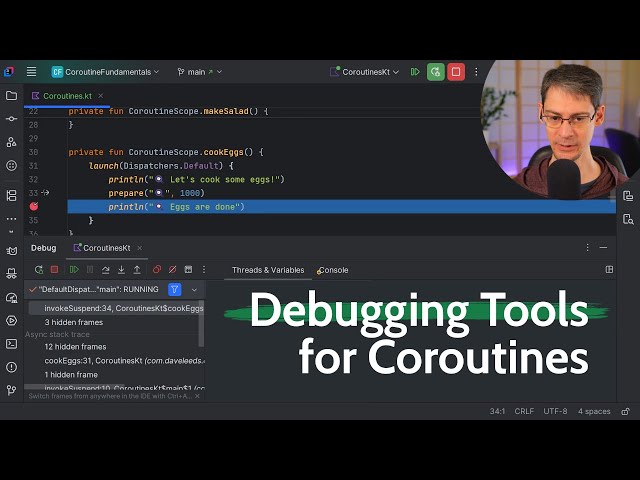
Coroutines bring new challenges when it comes to debugging - regular stack traces aren't much help when the async work was ...
3,582 views
9 months ago
Support me on Patreon:* https://patreon.com/platima *Buy Yours Now:* https://shop.plati.ma/products/waveshare-rp2350-geek ...
3,452 views
Dynatrace Live Debugging is no longer limited to Full‑Stack OneAgent deployments. In this Observability Clinic, Andi and Josh ...
855 views
Cursor can now fix your trickiest bugs. Debug Mode instruments your code, spins up a server to capture logs, and streams runtime ...
27,328 views
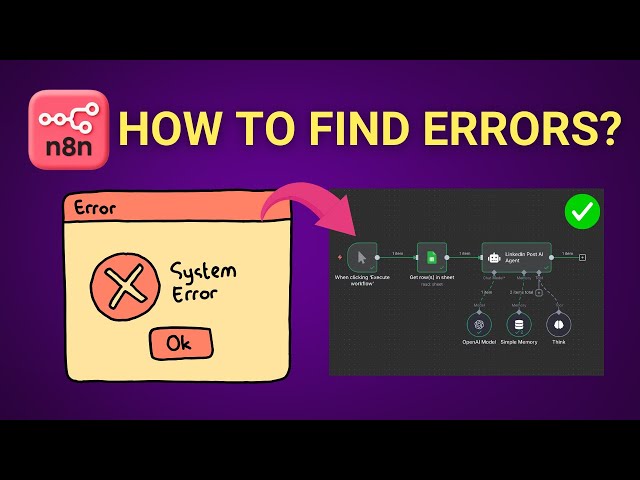
Are you struggling with errors in your n8n AI automation workflows? In this comprehensive lesson, we dive deep into how to ...
628 views
4 months ago
You can find the lecture notes and exercises for this lecture at https://missing.csail.mit.edu/2026/debugging-profiling/ 0:00:00 ...
10,903 views
If you're only using console.log(), you're missing out on some powerful features that can help you debug faster and cleaner with ...
8,522 views
This interview was recorded for the GOTO Book Club. #GOTOcon #GOTObookclub http://gotopia.tech/bookclub Read the full ...
1,400 views
8 months ago
You've just built your first project using the Climate Action Kit, but it's not working quite how you expected. What do you do next?
35 views
Debugging EMI: Oscilloscope vs. Spectrum Analyzer! Join Masha as she explores the world of electromagnetic interference (EMI) ...
10,548 views
all of that work and we end up with an ugly house that isn't even functional lol Annual St. Jude Fundraiser!
452,520 views
Sign up for the course: https://dub.sh/nocodemba Get 59 free AI business ideas here: https://dub.sh/free-ai-biz-ideas Struggling to ...
3,816 views
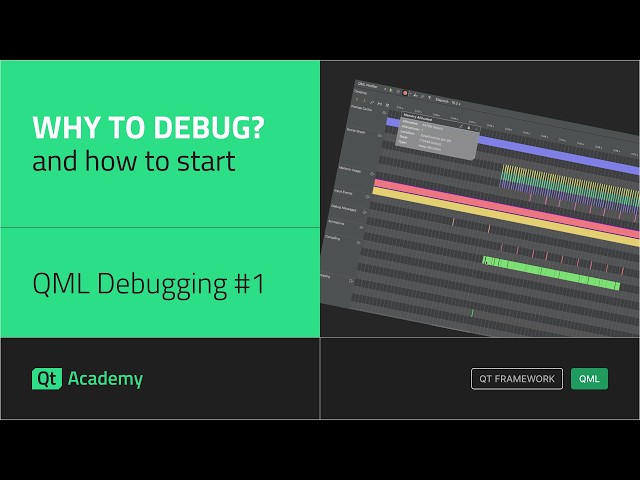
Discover why debugging is a critical skill for developers and how Qt Creator's debugging tools can assist in your development ...
227 views