Upload date
All time
Last hour
Today
This week
This month
This year
Type
All
Video
Channel
Playlist
Movie
Duration
Short (< 4 minutes)
Medium (4-20 minutes)
Long (> 20 minutes)
Sort by
Relevance
Rating
View count
Features
HD
Subtitles/CC
Creative Commons
3D
Live
4K
360°
VR180
HDR
185 results
Variables, Constants & Data Types | Lecture 06 | Python Tutorial for Beginners In this video, you will learn the fundamentals of ...
0 views
6 days ago
How to use Python to create categorical data bar and pie charts. Bar charts and pie charts are utilized for displaying the ...
You will also see how Python prevents data loss during arithmetic operations and how different data types behave during ...
13 views
4 days ago
How to use Python to calculate categorical descriptive statistics. Categorical descriptive statistics are utilized for summarizing the ...
How to test the assumption of univariate normality in Python. The Kolmogorov-Smirnov One-sample Test or the Shapiro-Wilk tests ...
How to create charts for ordinal data in Python. Stacked bar charts are utilized for displaying the distribution of an ordinal variable.
How to conduct a Factorial Analysis of Variance in Python. Factorial ANOVAs are utilized for comparison of groups on more than ...
How to conduct a Cramer's V in Python. Cramer's V tests are utilized for relating two categorical variables. This video ...
For more information about Stanford's Artificial Intelligence professional and graduate programs, visit: https://stanford.io/ai To learn ...
5,512 views
python Join this channel to get access to perks: https://www.youtube.com/channel/UC4C_tfy6WLDxzVVO3y6YinA/join This is my ...
27 views
How to conduct a Mann-Whitney U test in Python. Mann-Whitney U tests are utilized for comparison of two groups on an ordinal ...
How to generate descriptive statistics of continuous data in Python. Continuous descriptive statistics such as means and standard ...
How to conduct a Contingency Analysis in Python. Contingency Analysis with Cochran and Mantel-Haenzsel Chi-Squares are ...
So basically asking about data type. Yeah. >> 25F2006946 MANISH: very, very >> Programming in Python: Yeah, so that's it is ...
700 views
Streamed 4 days ago
How to generate descriptive statistics of continuous data in Python. Continuous descriptive statistics such as skewness and ...
Robert Lange, founding researcher at Sakana AI, joins Tim to discuss *Shinka Evolve* — a framework that combines LLMs with ...
3,539 views
13 hours ago
How to use Python to calculate ordinal descriptive statistics. Ordinal descriptive statistics are utilized for summarizing the ...
How to create a Histogram in Python. Histograms are utilized for displaying the distribution of a continuous variable. This video ...
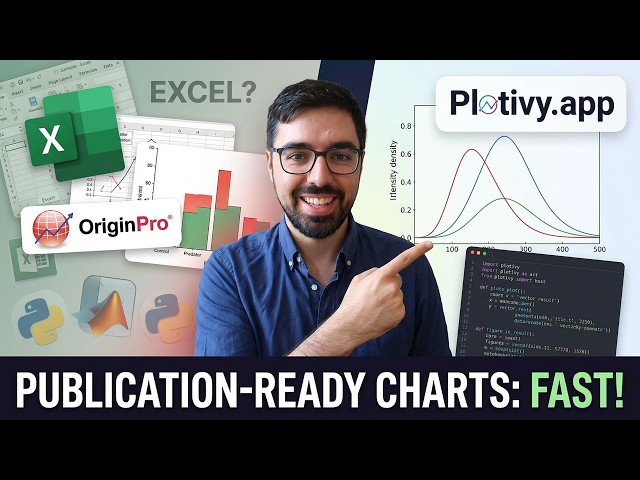
Scientists need reproducible, publication-ready figures, and Python is the gold standard, but the setup cost is too high for most ...
10 views
How to conduct a Cronbach's alpha Item Reliability Analysis using Python This video demonstrates how to conduct the ...