Upload date
All time
Last hour
Today
This week
This month
This year
Type
All
Video
Channel
Playlist
Movie
Duration
Short (< 4 minutes)
Medium (4-20 minutes)
Long (> 20 minutes)
Sort by
Relevance
Rating
View count
Features
HD
Subtitles/CC
Creative Commons
3D
Live
4K
360°
VR180
HDR
563 results
Power BI February 2026 Update – Every New Feature Explained The Power BI February 2026 Feature Summary just dropped, ...
3,474 views
5 days ago
Are you still manually finding and replacing typos one cell at a time? In this video, we stop being "Data Janitors" and start building ...
30 views
7 days ago
Excel tricks that works for any job: beginner, intermediate, and advanced. Get 20% off the Data Analyst Fast Track course ...
53,666 views
... MY COURSES - Go from Excel novice to data analysis ninja in just 2 hours: https://kevinstratvert.thinkific.com/ REQUEST ...
20,877 views
6 days ago
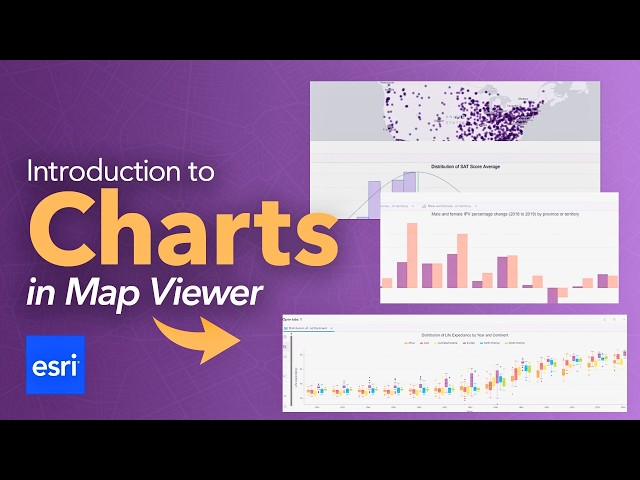
A chart is a graphical representation of data. In Map Viewer, charts are a useful tool for data exploration and analysis. In this video ...
471 views
Transform complex financial data into clear, compelling visuals. In this tutorial, we show you how to use S&P Capital IQ Pro's ...
62 views
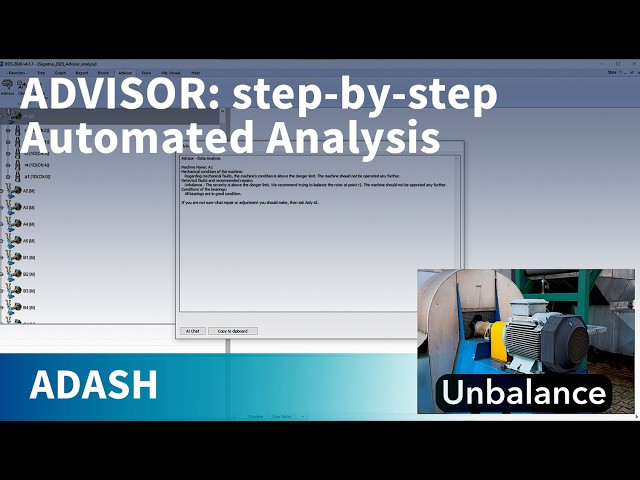
Advisor is a new feature in ADASH DDS designed to help you analyse machine faults quickly and confidently—even if you're new ...
389 views
If you're serious about beating the football markets, this one's worth your time. In this video, I break down an academic paper that ...
25,082 views
... #powerbitutorial #analytics #businessintelligence #dataanalysis #dataanalytics #datavisualization #datawarehouse #analytics ...
284 views
4 days ago
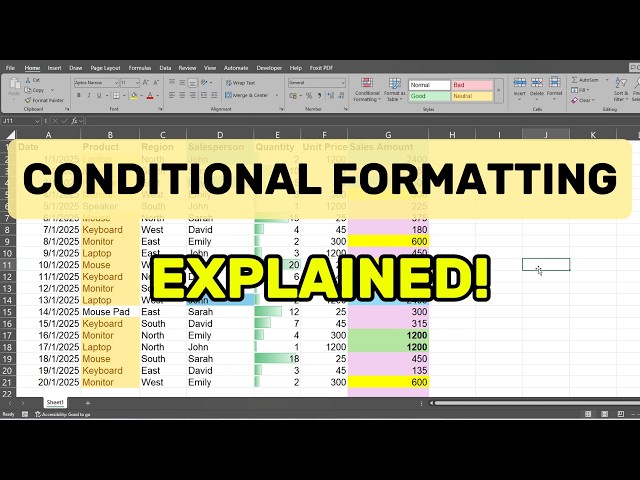
In this complete Excel tutorial, you'll learn how to use Conditional Formatting from basic rules to advanced formula-based logic ...
50 views
3 days ago
Microsoft Fabric Maps let you visualize real-time and historical location data directly inside Microsoft Fabric — and it's more ...
4,385 views
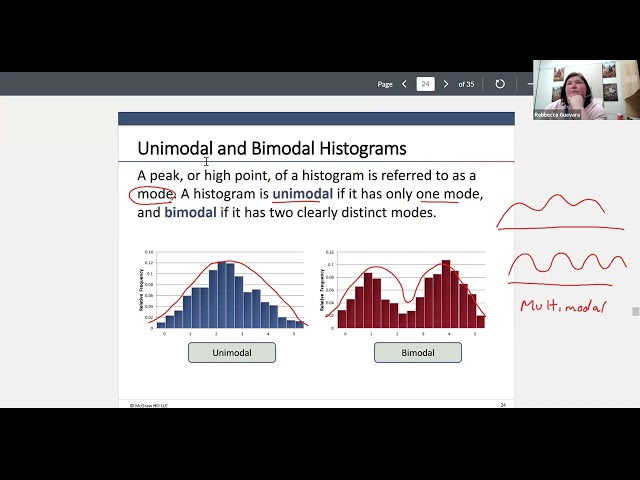
Rebbecca Guevara: Okay, so we're gonna look at shape of data. Rebbecca Guevara: So as you saw, the data have different ...
34 views
Transform your messy Excel spreadsheets into clean, analysis-ready data in seconds—without writing a single formula. In this ...
104 views
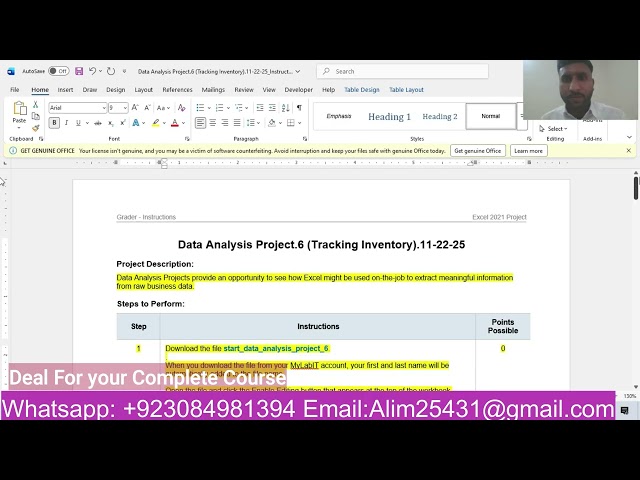
Whatsapp: +923177402009 Whatsapp: +923084981394 Email: Alim25431@gmail.com Whatsapp link: ...
0 views
1 day ago
Welcome to the Flir Assetlink tutorial from Flir Academy and produced by the Infrared Training Center! This first segment focuses ...
75 views
Patsnap Analytics brings patent data into one place so it can be searched, reviewed, and analyzed more easily. This short video ...
Yeh function specially useful hai data analysis, reporting, dashboard aur job interview preparation ke liye. Is video me hum cover ...
175 views
... + MATCH is very important for: • Data Analysis • MIS Executive • Accountant • Data Entry Operator • Excel Interview Preparation ...
167 views
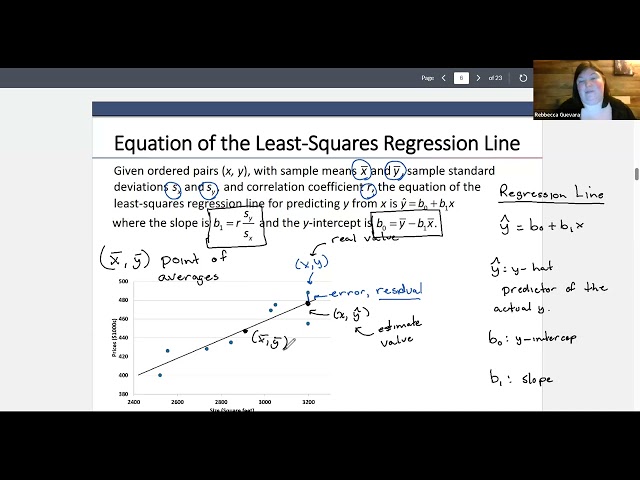
Regression line is going to be a estimate of an equation that is going to fit our data set. Rebbecca Guevara: So this is partially ...
ACT Science charts are designed to look easy—until one small detail costs you points. Learn how to read charts strategically with ...
108 views