Upload date
All time
Last hour
Today
This week
This month
This year
Type
All
Video
Channel
Playlist
Movie
Duration
Short (< 4 minutes)
Medium (4-20 minutes)
Long (> 20 minutes)
Sort by
Relevance
Rating
View count
Features
HD
Subtitles/CC
Creative Commons
3D
Live
4K
360°
VR180
HDR
890 results
This mini course will teach you some Python concepts and teach you to use some of Python's data transformers with the ...
1,234 views
3 weeks ago
How to reshape a dataset in Python. This video demonstrates how to reshape data from wide to long format in Python using ...
0 views
13 days ago
The Data Science Lab is a live weekly call. Register at pos.it/dslab! Discord invites go out each week on lives calls. We'd love to ...
817 views
10 days ago
Data science fundamentals involve an interdisciplinary approach to extracting actionable insights from data through a structured ...
15 views
Python Data Types in 15 Minutes (int, float, string, bool) | Python for Beginners | AI Jobs 2026. Naresh IT #ai #motivation #job ...
13 views
2 weeks ago
How to use Python to create categorical data bar and pie charts. Bar charts and pie charts are utilized for displaying the ...
How to conduct a Contingency Analysis in Python. Contingency Analysis with Cochran and Mantel-Haenzsel Chi-Squares are ...
How to create charts for ordinal data in Python. Stacked bar charts are utilized for displaying the distribution of an ordinal variable.
How to conduct an Analysis of Variance (ANOVA) in Python. One-way ANOVA are utilized for comparison of more than two groups ...
How to conduct a Multivariate Analysis of Variance in Python. MANOVAs are utilized for comparison of groups on more than one ...
How to conduct a Simple Linear Regression in Python. Simple Linear Regression tests are utilized for predicting the likely ...
How to conduct a McNemar's test in Python. McNemar's tests are utilized for comparison of two categorical variables, similar to the ...
How to conduct a Multiple Regression in Python. Multiple Regression tests are utilized for predicting the likely outcome of a ...
Want to learn NumPy fast? In this short tutorial, you'll master the 5 essential NumPy commands that every data scientist uses ...
1 view
How to create a Scatterplot in Python. Scatterplots are utilized for displaying the relationship between two continuous variables.
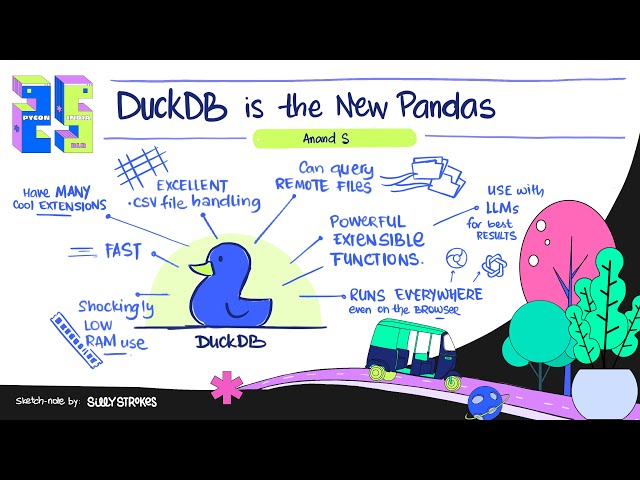
Traditional Pandas workflows have long been the go-to for Python data analysis, but as datasets grow larger and queries more ...
47 views
6 days ago
How to conduct a Repeated Measures Analysis of Variance in Python. Repeated Measures ANOVAs are utilized for comparison ...
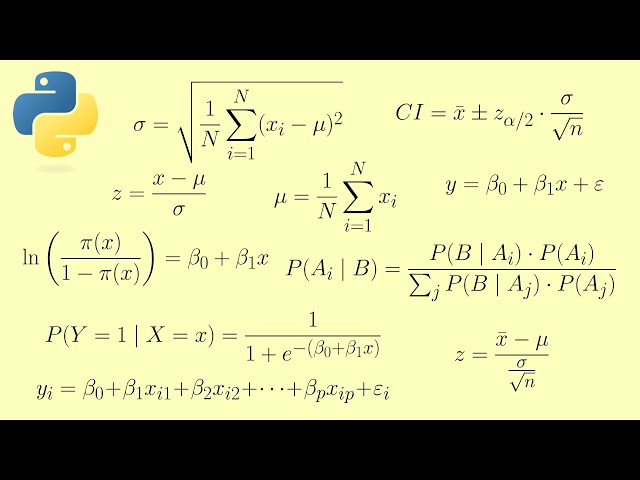
This video introduces some fundamental concepts of statistics, which finds applications in data analysis, machine learning, ...
292 views
12 days ago
How to use Python to calculate ordinal descriptive statistics. Ordinal descriptive statistics are utilized for summarizing the ...
How to conduct a Multivariate Analysis of Covariance in Python. MANCOVAs are utilized for comparison of groups on more than ...