Upload date
All time
Last hour
Today
This week
This month
This year
Type
All
Video
Channel
Playlist
Movie
Duration
Short (< 4 minutes)
Medium (4-20 minutes)
Long (> 20 minutes)
Sort by
Relevance
Rating
View count
Features
HD
Subtitles/CC
Creative Commons
3D
Live
4K
360°
VR180
HDR
13,729,739 results
Want your own Explainly video? Contact us for a free estimate @ https://www.explainly.com/ Explainly is a talented and versatile ...
16,602 views
5 years ago
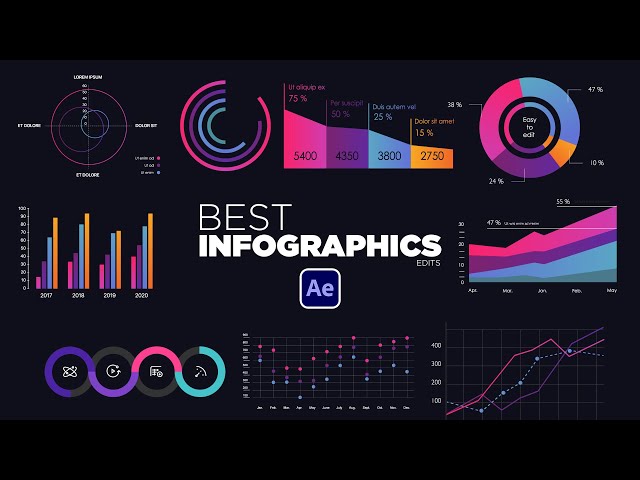
25000+ After Effects & Premiere Pro Templates: https://www.sonduckfilm.com/ - Here are 5 infographic edits you should know in ...
142,849 views
2 years ago
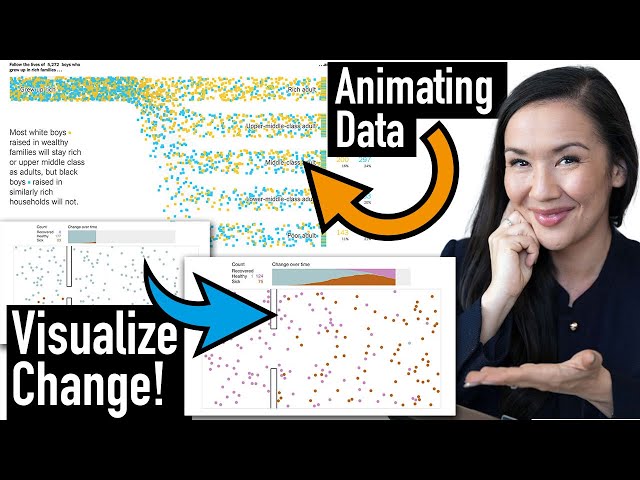
Welcome to our latest video! I'm Dr. Padilla, a professor of computer science and psychology with a passion for understanding ...
861 views
1 year ago
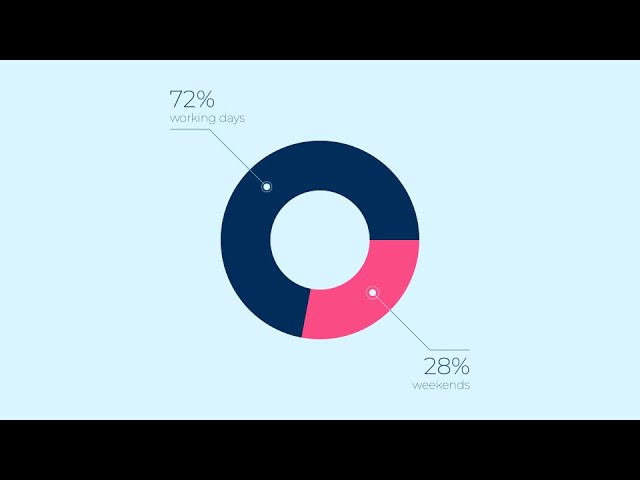
Hi, I'm Anastasiya, a 2d animator and motion designer from Russia. I have been working in this field for more than a year and I ...
11,635 views
4 years ago
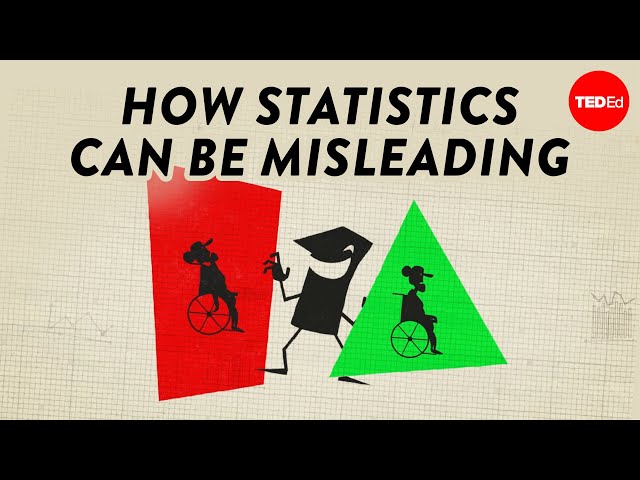
Explore the statistical phenomenon known as Simpson's paradox, and how it can lead to incorrect conclusions about data.
1,614,720 views
10 years ago
A brief overview about statistics and common vocabulary used in the field of statistics. If you found this video helpful and like what ...
967,068 views
Your quick 4 minutes guide to Hypothesis Testing. NOTE that Hypothesis Testing is heavily applied in real life statistics so you ...
1,420 views
7 years ago
131 views
8 years ago
5,212 views
Discover the advantages of animated explainer videos. Use them to promote your products & services! Animated video made by ...
2,286 views
12 years ago
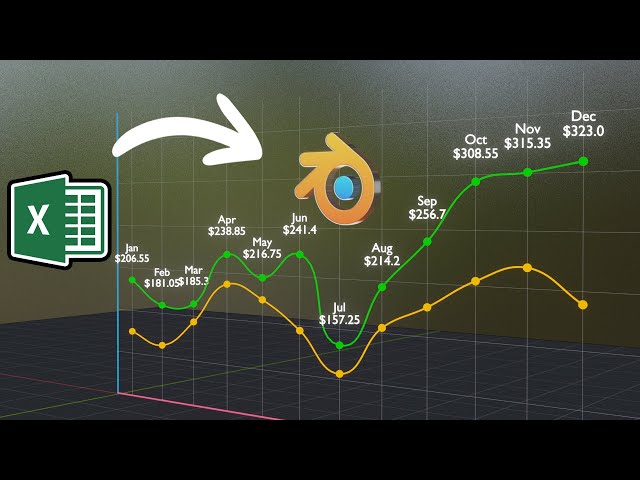
In this Blender tutorial, we have discussed how to convert some excel data into a 3D line graph with animation. We will use a ...
32,369 views
563 subscribers
The video above is more focused on the concept. This other one explains how it's calculated: ...
2,968,636 views
Using a trend in a metric over time to tell a visualisation story with the data. It is so easy to create this visual with Power BI and the ...
9,293 views
Join the RonDi CoLab: a membership to build a real, sustainable content business https://www.teamrondi.com/the-rondi-colab ...
58,336 views
3 years ago
Access All the videos (Ranking) of my channel !! https://www.youtube.com/channel/UCDsjtK-u5cIAzGDtW5lOWKw/videos ...
210 views
In this video, I'll show you some cool tricks to take your Google Looker Studio visualization skills to the next level. I'll show you for ...
45,495 views
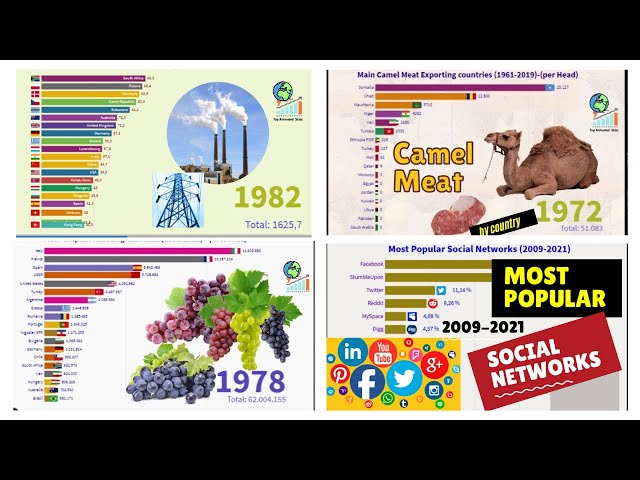
In this Blender tutorial, we have discussed how to create world data videos. These videos on world statistics are very popular ...
230,569 views
25.6K subscribers