Upload date
All time
Last hour
Today
This week
This month
This year
Type
All
Video
Channel
Playlist
Movie
Duration
Short (< 4 minutes)
Medium (4-20 minutes)
Long (> 20 minutes)
Sort by
Relevance
Rating
View count
Features
HD
Subtitles/CC
Creative Commons
3D
Live
4K
360°
VR180
HDR
4,163,922 results
In this video i will explain how to create a bar chart with two series and green and red arrows for the differences. Data labels will ...
257,127 views
4 years ago
Learn how to create a dynamic Bar Chart Race animation video using Flourish and Canva! In this step‑by‑step tutorial, I'll show ...
915 views
1 month ago
A bar chart is especially useful with comparing two sets of data. The difference in the bars give us a quick snapshot that allows us ...
996,208 views
10 years ago
Tips for an IELTS bar chart in writing task 1: finding key features, paragraph content: (introduction, overview and body paragraphs) ...
6,471,661 views
11 years ago
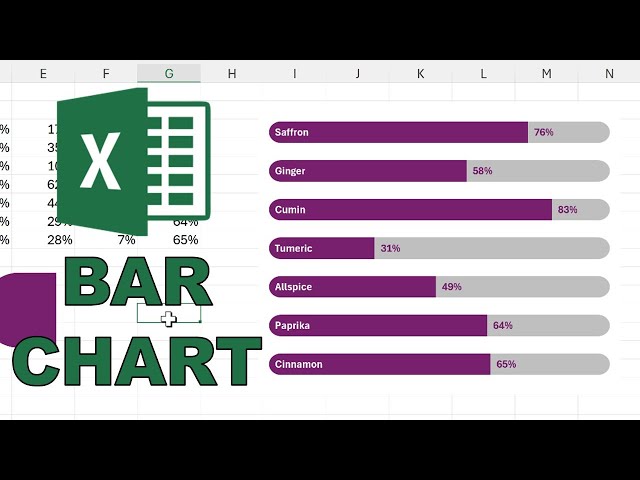
Create a bar chart with rounded corners and data labels.
53,460 views
1 year ago
In today's video, I'm going to be teaching you how to make a racing bar chart / graph like the ones you might have seen on ...
149,896 views
5 years ago
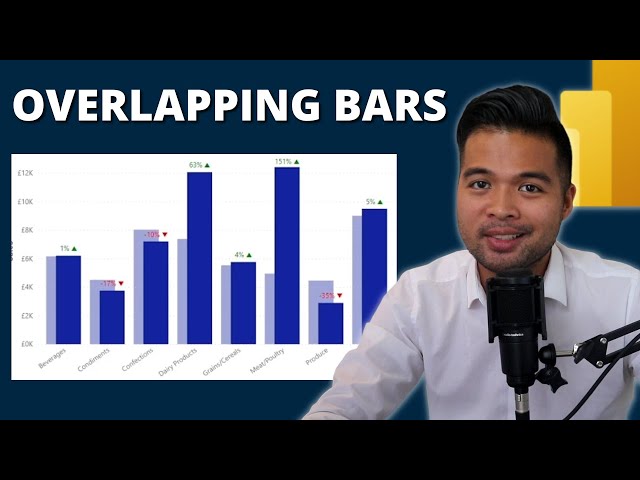
In this video were going to cover how you can create an overlapping bar chart, visualising two sets of data showing variance ...
72,635 views
2 years ago
In this video I cover different world's five most popular types of graph and when they should be used. For example, a bar chart is ...
231,234 views
Make Bar Chart Race Videos via https://alienart.io Discord: https://discord.gg/DQUdFXd6Px Reddit: ...
153,311 views
In this video, we learn how to draw comparative bar charts or bar graphs. We look closely at how to structure the bars for one ...
4,681 views
3 years ago
earn $6000/M making bar chart race video | flourish studio full tutorial 2022 | make money online. racing bar graph, in this video, ...
28,605 views
In this video you will learn how a histogram is different than a bar chart. Welcome to MooMooMath where we upload a new Math ...
241,829 views
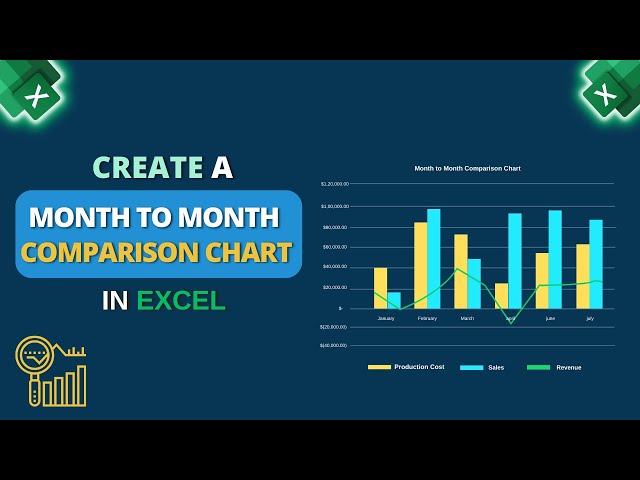
In this video, I'll guide you through three steps to create a month-to-month comparison chart in Excel. You'll learn about, creating ...
62,247 views