Upload date
All time
Last hour
Today
This week
This month
This year
Type
All
Video
Channel
Playlist
Movie
Duration
Short (< 4 minutes)
Medium (4-20 minutes)
Long (> 20 minutes)
Sort by
Relevance
Rating
View count
Features
HD
Subtitles/CC
Creative Commons
3D
Live
4K
360°
VR180
HDR
5,631 results
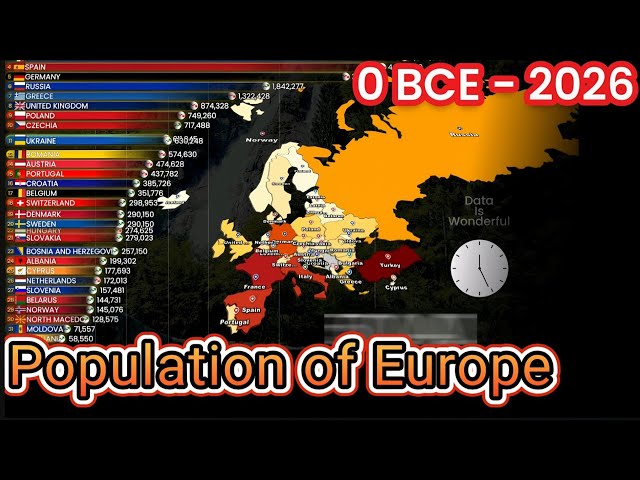
This video shows the population ranking of European countries from 0 AD to 2026 based on historical demographic estimates and ...
139 views
7 days ago
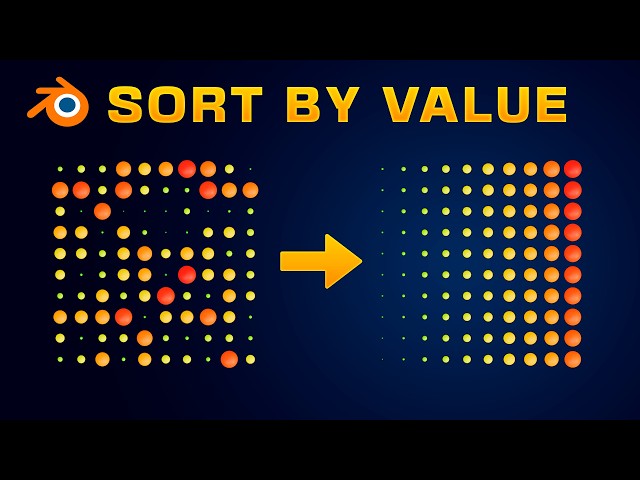
Learn how to sort and reorganize objects in Blender using Geometry Nodes based on any numerical value or attribute. In this ...
2,849 views
Google just released Nano Banana 2 (Gemini 3.1 Flash Image) — and it solves the biggest tradeoff in AI image generation: speed ...
31,849 views
5 days ago
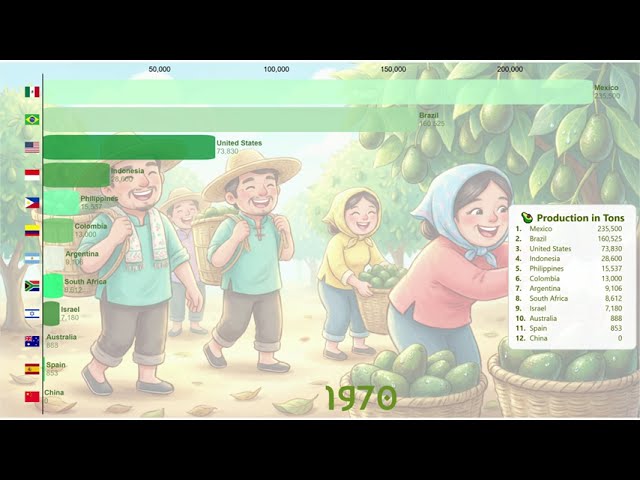
From a simple fruit to a global obsession — avocados have taken over the world! Watch how avocado production has ...
11 views
6 days ago
If you liked this video, you can support me here: https://ko-fi.com/marcusguidesyou or here: https://paypal.me/marcusstoneytb Or if ...
0 views
Grab this exact project template (Data Cleaning & Visualization): ...
6,430 views
Jonathan Fishner built ChartDB, an open source database visualization tool for developers. This video breaks down how to ...
48,212 views
Data Analyst or Data Engineer in 2026? In this video, I break down the real differences, skills, salaries, and career paths to help ...
23,508 views
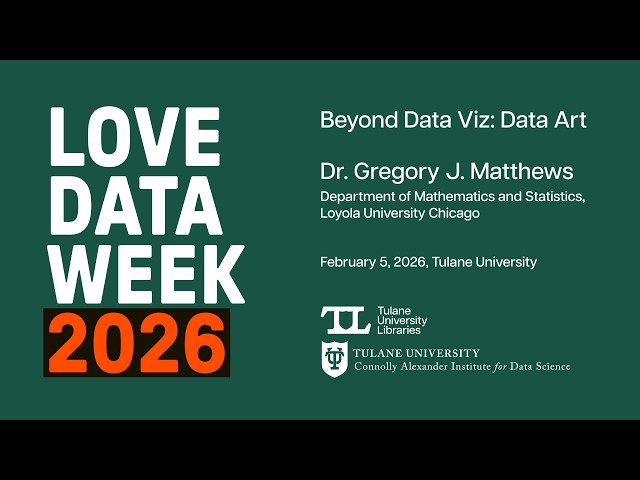
Greg Matthews, associate professor in the Department of Mathematics and Statistics and director of the interdisciplinary Data ...
7 views
4 days ago
FREE GIFT — The Manifest Reset Guide : https://go.manifestaxis.com/ Stop visualizing at the wrong level. Start creating at the ...
22,238 views
What is data visualization, why it helps business teams make faster decisions, and the most common mistake people make when ...
2 days ago
See how to build a text-to-SQL agent using the FutureSmart Agent platform — ask questions in plain English and get answers ...
257 views
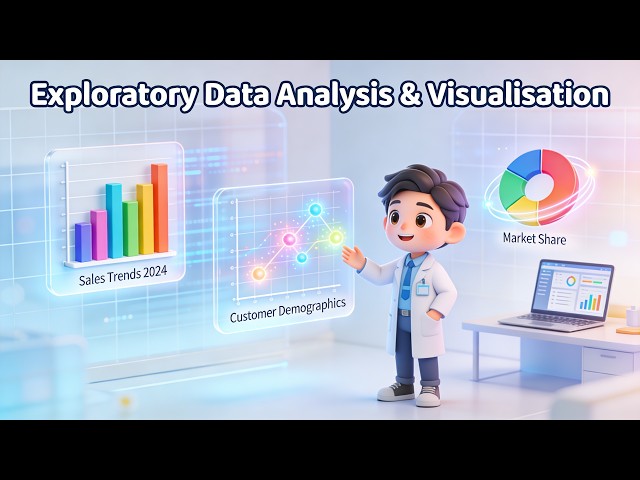
In this video, we explore "Exploratory Data Analysis and Visualization: A Beginner's Guide." Exploratory Data Analysis (EDA) is a ...
This recorded workshop from UC Love Data Week 2026 will introduce you to the transformative potential of AI-assisted data ...
49 views
Okay i'll just put it here and I'm going to go to data visualizations okay and you can uh download the zip files okay and then I can ...
14 views
1 day ago
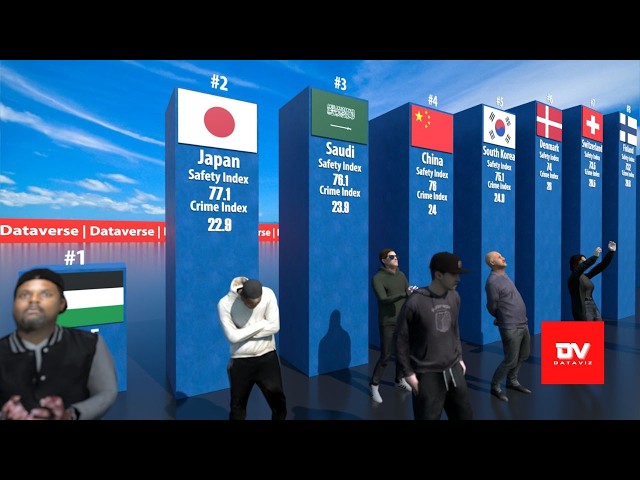
In this video, we explore the Crime Rate by Country 2026 using immersive 3D Data Visualization. We have ranked and compared ...
320 views
We've all been there: you've got data, you've got a message… and then you freeze at the chart menu. In this video, Dr Selena Fisk ...
13 views
Turn boring numbers into colorful visual bars in Excel! In this quick tutorial, I'll show you how to use the REPT formula to ...
What if your data could explain itself? In this video we demonstrate how AI data visualization is changing the way people analyze ...
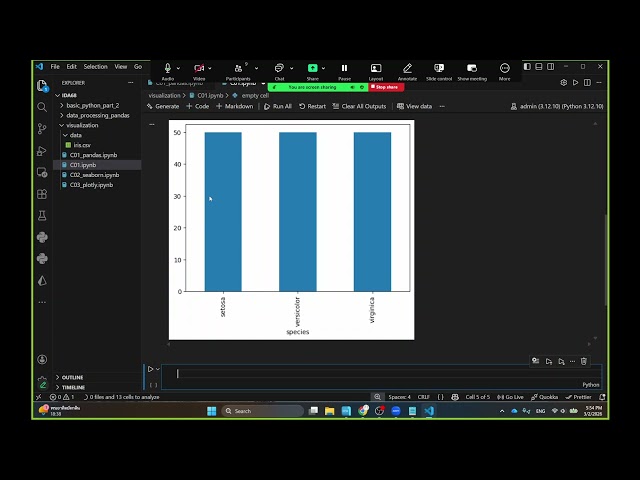
In this video, you'll create three simple data visualizations in Python by analyzing a Kaggle dataset on chocolate sales. You'll also ...
34 views