Upload date
All time
Last hour
Today
This week
This month
This year
Type
All
Video
Channel
Playlist
Movie
Duration
Short (< 4 minutes)
Medium (4-20 minutes)
Long (> 20 minutes)
Sort by
Relevance
Rating
View count
Features
HD
Subtitles/CC
Creative Commons
3D
Live
4K
360°
VR180
HDR
702 results
What is data visualization, why it helps business teams make faster decisions, and the most common mistake people make when ...
0 views
20 hours ago
In this video, we break down data visualization in plain English: what it is, why it helps business teams make faster decisions, and ...
16 hours ago
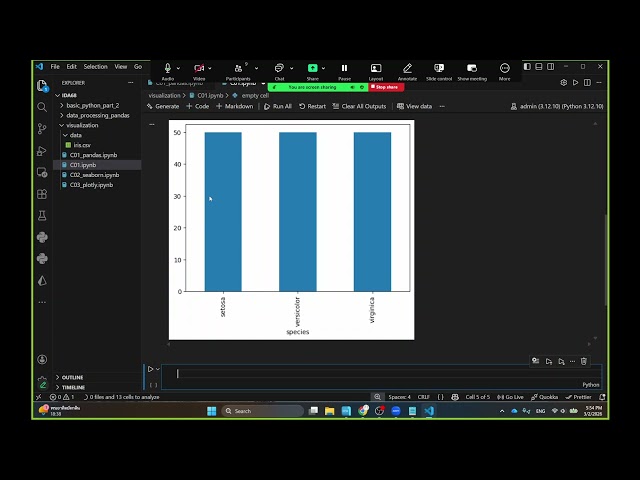
Okay i'll just put it here and I'm going to go to data visualizations okay and you can uh download the zip files okay and then I can ...
11 hours ago
It then covers advanced Excel features for data visualization, interactive dashboards, and business reporting. You will explore ...
1,360 views
Streamed 12 hours ago
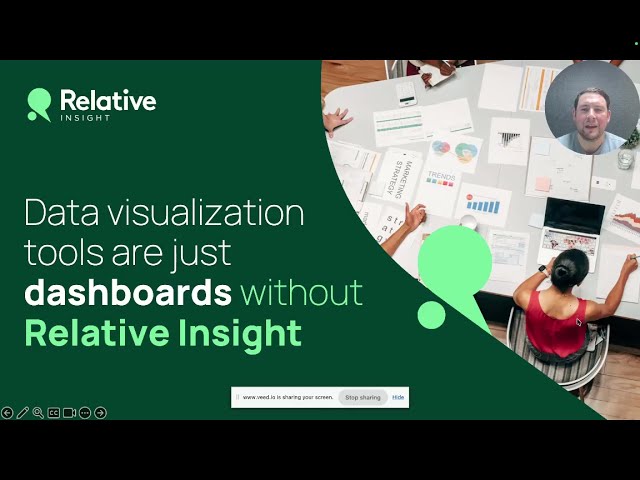
In this on-demand webinar James Cuthbertson, CRO at Relative Insight, explains how leading organizations combine quantitative ...
13 hours ago
Like | Comment | Subscribe for more expert-led Excel, Power BI, and data visualization sessions. #KoenigWebinars ...
35 views
Streamed 21 hours ago
... Data Analysis Specialization - https://coursera.pxf.io/AoYOdR Tableau Data Visualization - https://coursera.pxf.io/MXYqaN ...
0
Ready to build your first interactive dashboard? In this tutorial, I'll show you how to go from raw data to a stunning, modern ...
14 hours ago
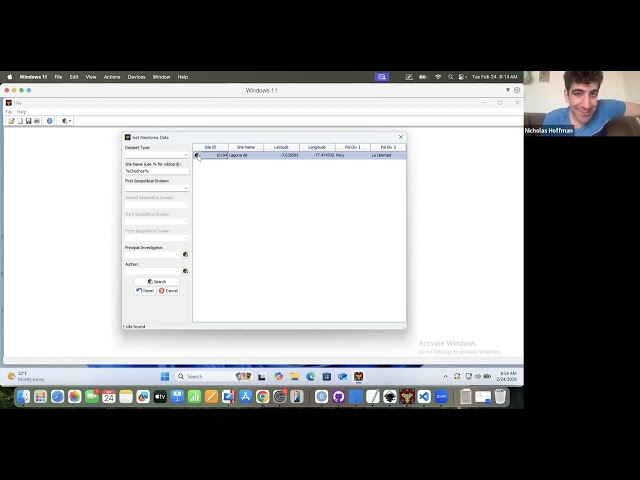
On February 24th, 2026, Nick Hoffman, data steward at the Neotoma Paleoecology Database, led a virtual workshop on using Eric ...
1 view
7 hours ago
545 views
AI is changing how we visualize and interact with data. In a world where users can simply ask questions of their data in natural ...
In this project, I built an interactive Microsoft Excel dashboard to analyze job market trends and extract meaningful insights from ...
23 hours ago
Learn how to create a Lollipop Chart in Excel using only native visuals—no custom visuals or App Source downloads required.
Lecture by Kuldeep Sharma Sir ------------------------------------------------------- PW Skills Finance PAID Batch Click Here To Enroll ...
837 views
Streamed 16 hours ago
... Power BI, and data visualization sessions. #KoenigWebinars #KoenigSolutions #StepForward #PowerBI #BusinessIntelligence ...
95 views
Streamed 15 hours ago
In this video, we break down the most important data visualization updates, including: • Expanded AI prompt limits • Major Card ...
2 hours ago
Full Demo: https://youtu.be/vanOstY5Jes In this video, we showcase the powerful capabilities of Databricks in building ...
66 views
19 hours ago
... Louis Badr, Claudio Pacchierotti, Anatole Lécuyer, Arnaud Prouzeau Abstract: Data visualization benefits from non-visual cues ...
3 views
Keywords: how to improve a chart, improve data visualisation, data storytelling, chart design tips, fix your charts, make charts ...
Annina Brügger's talk at the Data Visualization Meetup 2025 about designing a unified drought monitoring platform. She shares ...
23 minutes ago