Upload date
All time
Last hour
Today
This week
This month
This year
Type
All
Video
Channel
Playlist
Movie
Duration
Short (< 4 minutes)
Medium (4-20 minutes)
Long (> 20 minutes)
Sort by
Relevance
Rating
View count
Features
HD
Subtitles/CC
Creative Commons
3D
Live
4K
360°
VR180
HDR
9,691,365 results
You've probably heard the term data visualization thrown around a lot. It's why you're here, isn't it? So let's make it clear — data ...
181,276 views
3 years ago
"️ IBM - Data Analyst ...
320,501 views
8 years ago
Let's look at how we can implement design concepts and techniques to maximize the impact of our dashboards and reports.
86,712 views
4 years ago
This comprehensive tutorial will teach you everything you need to know about Excel chart types, chart customization, and creating ...
110,779 views
1 year ago
Links mentioned in this video ⬇️ Exercise File ...
250,093 views
2 years ago
Use the code "DATA" to get 25% off The Big Nodebook!!! https://mtranimationgumroad.gumroad.com/l/thebignodebook/DATA Use ...
100,728 views
6 months ago
MENTORSHIP – Applications for the March 2026 cohort are now open! Apply here → https://theanalyticsaccelerator.com/ We're ...
50,351 views
11 months ago
Join my Academy, learn Data & AI skills and land a job https://analyticsautomation.academy/ Mind map available here ...
4,828 views
4 months ago
In this video, we will demonstrate the difference between data visualization charts including: - Bar Chart - Line Chart - Bubble ...
188,908 views
6 years ago
In this video, I break down some of the 'science' behind effective data visualization and how you can build better dashboards by ...
383,811 views
Saw the intern visualizing his data like this so I showed him this tip activate python store your data as a python data.
83,046 views
3 AI Tools for Data Visualization Everyone Should Try #makemoneywithai Stop wasting hours on tasks that AI can handle in ...
159,973 views
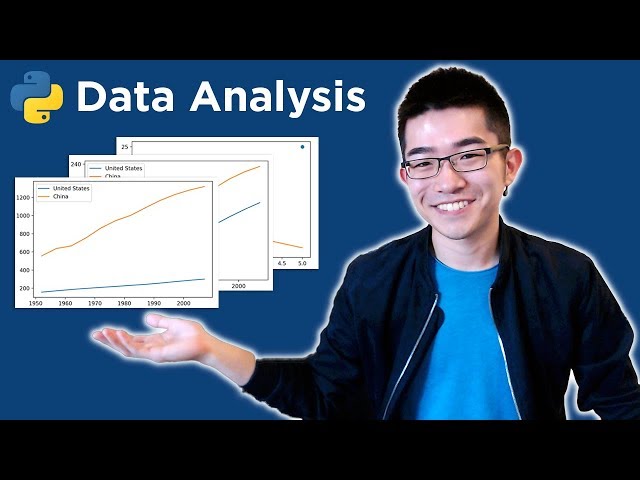
Python data analysis / data science tutorial. Let's go! For more videos like this, I'd recommend my course here: ...
1,532,486 views
7 years ago
222K subscribers
Check out our Data Storytelling platform at graphy.app/
15,078 views
Try RESPLENDENT DATA for FREE and unlock the full potential of your data: https://resplendentdata.com/mochen Portfolio, ...
6,253 views
9 months ago
Join my Python Masterclass - https://www.zerotoknowing.com/join-now ***Save 20% off your First Month with code: save20now at ...
17,060 views
In this video lecture series, we introduce Power BI (Business Intelligence), show users how to create data dashboards with visuals ...
7,139 views