Upload date
All time
Last hour
Today
This week
This month
This year
Type
All
Video
Channel
Playlist
Movie
Duration
Short (< 4 minutes)
Medium (4-20 minutes)
Long (> 20 minutes)
Sort by
Relevance
Rating
View count
Features
HD
Subtitles/CC
Creative Commons
3D
Live
4K
360°
VR180
HDR
1,940 results
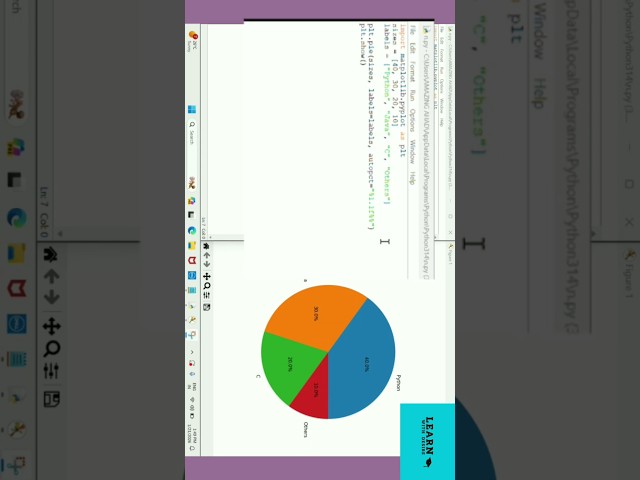
Visualize data using Matplotlib. #matplotlib #python #shorts.
18 views
16 hours ago
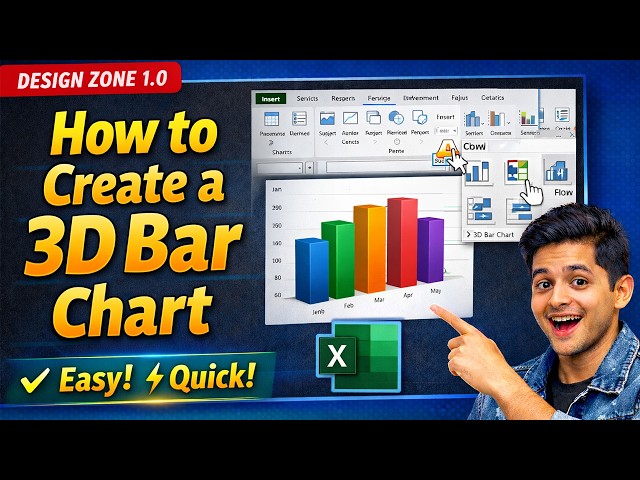
Learn how to create a 3D bar chart in Excel quickly and professionally in this step-by-step tutorial. In this video, you will discover ...
0 views
1 day ago
3 views
6 days ago
... Building reports that answer real questions 02:45-04:03 — The importance of data quality 04:04-05:24 — Data visualization as ...
693 views
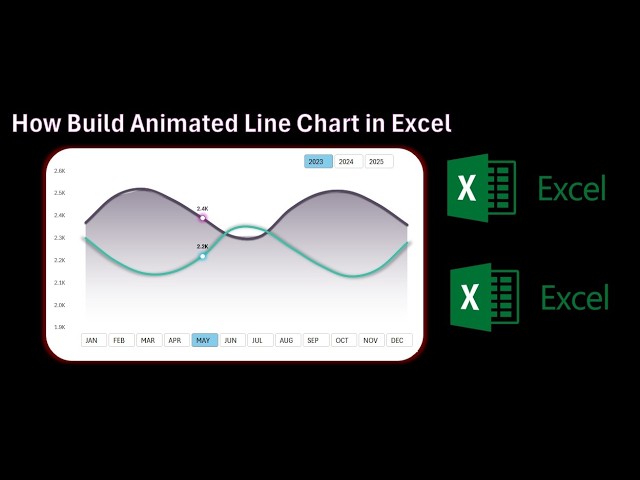
In this video, you will learn how to build an Animated Line Chart in Excel with interactive month and year buttons. This modern ...
13 views
... Google just launched a massive update to NotebookLM featuring custom infographic styles and advanced data visualization.
4,141 views
5 days ago
The goal of this data visualization project was to use a song as a dataset and visualize how a guitar works from multiple ...
PDF: Mastering Matplotlib: The Data Scientist's Guide to Python Visualization ...
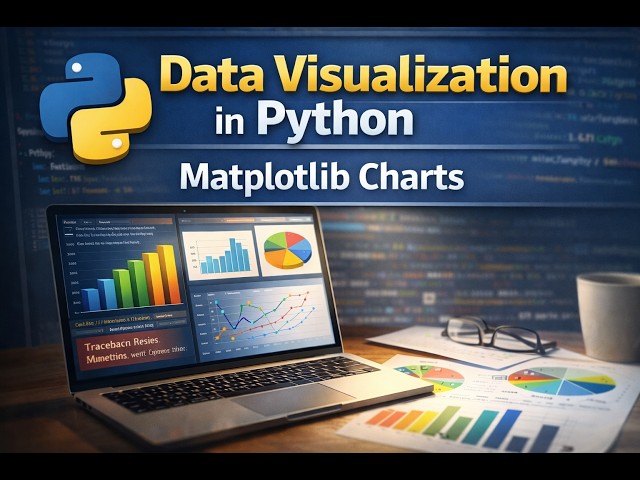
In this video, you will learn Data Visualization using Matplotlib in Python in a simple and beginner-friendly way. Data visualization ...
4 views
This video walks through how to run a RuFaS simulation by creating biophysical input files, linking metadata and file paths, and ...
24 views
4 days ago
Master Microsoft Excel from absolute zero! This is your full beginner tutorial to master spreadsheets. Forget the overwhelm, we'll ...
181 views
A mini-training session for my friends in BI/DS master program on how to use Polars, Matplotlib and Seaborn in data analysis and ...
39 views
In this video, you will learn: ✓ Excel for Data Analysis ✓ Power BI for Data Visualization ✓ SQL for Database Querying ✓ Python ...
Power BI Full Course Tutorial. Power BI is Microsoft's business intelligence and data visualization platform. It helps individuals ...
38 views
[0:00 - 0:20] The "First Video" Hook "Stop watching boring math lectures. Most Machine Learning courses fail because they ...
10 views
Most people try to fix broken Power BI dashboards by moving visuals around. That almost never works. In this video I take a Power ...
42 views
... #sql #tableau #datavisualization #exceltraining #dataanalysis #excelwithchatgpt #officeproductivity #exceltips #googleSheets ...
Story telling is a big part of data visualization. This Business intelligence project video explains all the different charts in the ...
21 views
... Creating Power BI Reports On PUBG Data IPL Data Visualization with Power BI Sales Analysis using Power BI Power BI Project ...
5,584 views
Streamed 5 days ago
In this session of Rising Bihar Python Learning Series, we explore how to analyse Excel data and create meaningful data ...