Upload date
All time
Last hour
Today
This week
This month
This year
Type
All
Video
Channel
Playlist
Movie
Duration
Short (< 4 minutes)
Medium (4-20 minutes)
Long (> 20 minutes)
Sort by
Relevance
Rating
View count
Features
HD
Subtitles/CC
Creative Commons
3D
Live
4K
360°
VR180
HDR
2 results
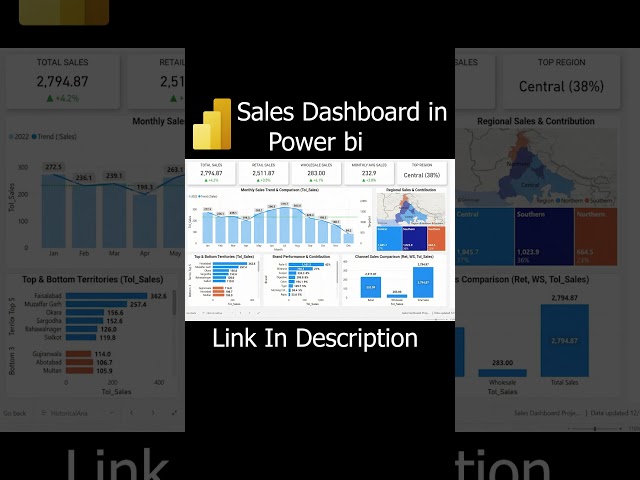
Learn how to create an End-to-End Power BI Sales Dashboard step by step. This beginner-friendly Power BI tutorial takes you ...
0 views
8 minutes ago
Master quantitative cyber risk modeling with this interactive ransomware bow tie chart built in Python using Plotly. Prof. Hernan ...
55 minutes ago