Upload date
All time
Last hour
Today
This week
This month
This year
Type
All
Video
Channel
Playlist
Movie
Duration
Short (< 4 minutes)
Medium (4-20 minutes)
Long (> 20 minutes)
Sort by
Relevance
Rating
View count
Features
HD
Subtitles/CC
Creative Commons
3D
Live
4K
360°
VR180
HDR
733 results
How to Visualize Data on Excel (updated) | Surfshark VPN Deal — Stay private and secure. $1.99/mo + 3 Months Free ...
0 views
5 days ago
We focus on project-based learning to help you master data and reclaim your time. #excel #datavisualization #SocialImpact ...
485 views
6 days ago
How to Graph with Excel - Full Guide | Surfshark VPN Deal — Stay private and secure. $1.99/mo + 3 Months Free ...
Excel templates for business and personal productivity require structured data tracking and clean visual interfaces. This Excel ...
39 views
23 hours ago
Struggling to turn raw data into clear and meaningful charts in Excel? In this training, I'll show you how to create simple, clean, and ...
103 views
1 day ago
... and team health indicators can coexist in a single, clear, and professional data visualization model—ideal for project managers, ...
265 views
Excel to Power BI Thinking about moving from Excel to Power BI but not sure what to expect? This video breaks down the ...
54 views
Sponsored By TechLift Academy.
41 views
Welcome to Data Analysis Mastery This video covers: Learn how to create charts quickly in Excel using the Recommended Charts ...
2 views
You'll also learn how to create dynamic charts, analyze data with pivot tables, and use Excel for data visualization and business ...
5,389 views
18 hours ago
Introduction to Excel #dataanalytics #datavisualization #excel.
309 views
4 days ago
... Revenue Trends Line/Bar Charts Excel Formatting Data Visualization Spreadsheet Best Practices Excel Shortcuts Spreadsheet ...
This video presentation demonstrates how Microsoft Excel is used to organize grocery data using tables and formulas. It explains ...
19 views
Download the Practice Kit ⬇️ - https://goodly.co.in/combining-data-from-multiple-excel-files/ Register for the Power BI ...
6,512 views
2 days ago
How to graph in EXCEL using a multi-series line chart—step by step. This tutorial shows how to plot multiple lines on one chart (2, ...
108 views
Watch me speedrun Excel data analysis using nothing but natural language prompts! ⚡ THE CHALLENGE: Complete a full data ...
308 views
Data Analyst Masters Program (Discount Code - YTBE15) ...
18,520 views
If you're still building charts the old way and manually updating them every time data changes, PivotCharts are about to save you ...
25 views
Ann K. Emery Founder & Data Visualization Designer at Depict Data Studio How do you transform overwhelming data into clear, ...
18 views
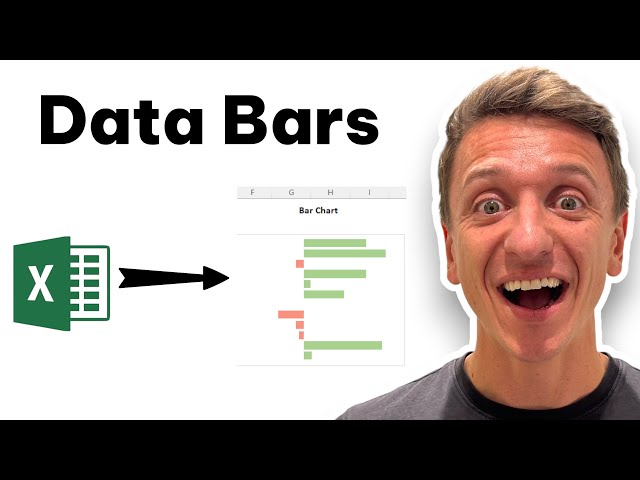
Learn how to use Data Bars in Excel to visualize numbers directly inside cells. This tutorial shows how to apply data bars using ...


![Advance Excel Full Course 2026 [FREE] | Advance Excel Tutorial | Advance Excel Course | Simplilearn](/api/proxy/image?url=https%3A%2F%2Fi.ytimg.com%2Fvi%2FSD2CM7UOCpc%2Fsddefault.jpg)