ViewTube

ViewTube
Sign inSign upSubscriptions
Filters

Upload date

Type

Duration

Sort by

Features

Reset

48 results

Gyan On Tube
Excel Charts Tutorial Hindi | Data Visualization से Freelancing Income

क्या आप जानते हैं कि Excel Charts और Data Visualization सीखकर आप ₹1000 या उससे ज़्यादा ...

10:43
Excel Charts Tutorial Hindi | Data Visualization से Freelancing Income

93 views

10 hours ago

Abrar Knowledge
Shade Alternate Rows in Excel 😎 | Improve Readability & Visuals Instantly | Excel Shorts

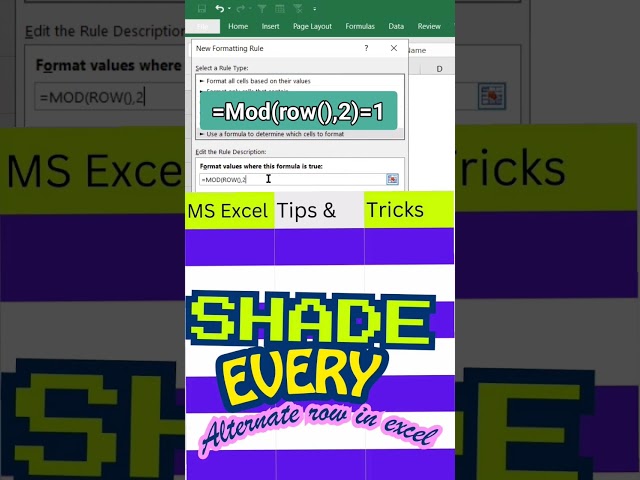
Want to make your Excel data cleaner, clearer, and easier to read? In this Excel Shorts video, learn how to shade every ...

1:02
Shade Alternate Rows in Excel 😎 | Improve Readability & Visuals Instantly | Excel Shorts

481 views

11 hours ago

Correlation One
How to Interpret Charts and Tables for Data Analysis

A: You look for trends, comparisons, and patterns that explain what the data is showing. *Q: What makes a good data visualization ...

1:24:27
How to Interpret Charts and Tables for Data Analysis

4 views

23 hours ago

Koenig Solutions
Copilot Skills for Modern Office Productivity

Copilot Skills for Modern Office Productivity January 18 · 4 PM IST – Set Reminder ▶️ AI is transforming the modern ...

1:36:03
Copilot Skills for Modern Office Productivity

34 views

Streamed 12 hours ago

Other Level’s
Is a Barber Shop Really Profitable? Let’s Check the Numbers #visibilitystudy

This video is part of the Business Visibility Studies series, where we analyze real projects using structured Excel data and ...

2:49
Is a Barber Shop Really Profitable? Let’s Check the Numbers #visibilitystudy

344 views

10 hours ago

Excel Tips and Tricks
Track Your Progress #excel #projectmanagement

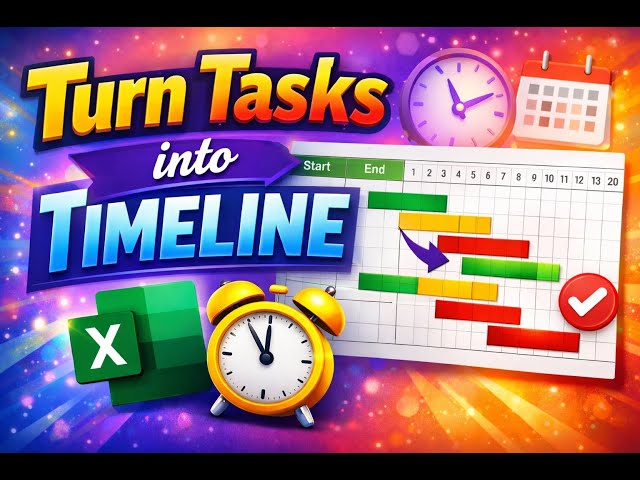
Subscribe: @newExcelTipsandTricks Learn how to create a clean and professional Gantt Chart in Microsoft Excel — perfect for ...

7:45
Track Your Progress #excel #projectmanagement

8 views

20 hours ago

Mwosh Tech Solutions Services
Power BI Visualization Tutorial for Beginners (Charts, Reports & Dashboards)-2026

... better analysis • Best practices for data visualization in Power BI This tutorial is perfect for students, beginners, business owners, ...

56:46
Power BI Visualization Tutorial for Beginners (Charts, Reports & Dashboards)-2026

14 views

11 hours ago

Artifact Geeks official
Top 5 Skills for Data Analysts 📊🚀 #shortsfeed #skills

Want to become a successful Data Analyst in 2026? These top 5 skills separate beginners from professionals: 1️⃣ Excel ...

0:20
Top 5 Skills for Data Analysts 📊🚀 #shortsfeed #skills

0 views

22 hours ago

Excel Primed
Excel Make Chart

Want your Excel charts to stand out without extra effort? Learn how to make them visually appealing using built-in design tools.

1:09
Excel Make Chart

0 views

11 hours ago

Professor Tanaka
Move a Chart to a New Tab in Excel

Charts don't have to live next to the data that created them. In Excel, you can move a chart to its own worksheet tab, rename it and ...

1:07
Move a Chart to a New Tab in Excel

0 views

11 hours ago

GenAI Skool
1 – What Is Microsoft Copilot? (Complete Beginner Introduction)

Discover Microsoft Copilot — Microsoft's AI-powered assistant built directly into Microsoft 365. In this lesson, we break down what ...

5:01
1 – What Is Microsoft Copilot? (Complete Beginner Introduction)

4 views

7 hours ago

Rizwan Graphic Designer
Class # 49 MS Excel 2007 Insert Tab_PivotTable_ List_Report Filter_Column Lables_Row Labels_Values

I'm “Rizwan Accounts Expert”, a Microsoft Excel expert. I am a Accounts & Internal & External Audit expert of Ms excel with over 05 ...

17:06
Class # 49 MS Excel 2007 Insert Tab_PivotTable_ List_Report Filter_Column Lables_Row Labels_Values

5 views

23 hours ago

PyStructEng
Automate Your Column Design with Python, Jupyterlab and xlwings (Step-by-Step Tutorial)|  Part 2

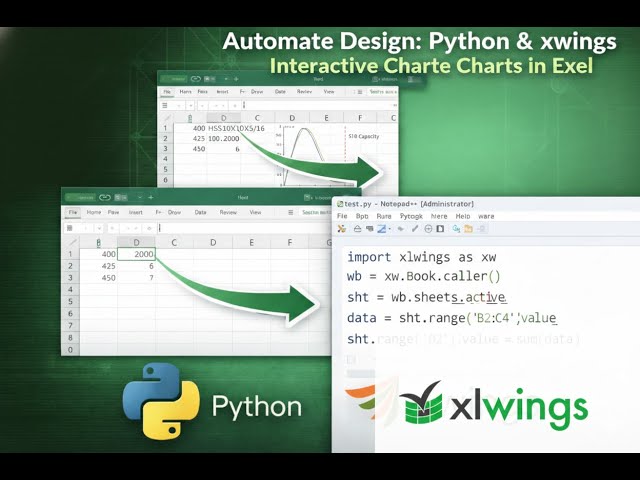
Stop struggling with messy Excel formulas and limited charting options. In this tutorial, we automate a CSA S16 HSS Column ...

29:00
Automate Your Column Design with Python, Jupyterlab and xlwings (Step-by-Step Tutorial)| Part 2

12 views

1 day ago

Raj Singh Microsoft
Windows Laptop Lag Fix Using Simple Setting | Raj Singh Microsoft Certified Trainer

💻⚡ Is your Windows laptop feeling slow and laggy? Whenever you search apps, do you see too many useless suggestions? This ...

1:23
Windows Laptop Lag Fix Using Simple Setting | Raj Singh Microsoft Certified Trainer

31 views

19 hours ago

Sandeep Rani
How to Become a Data Analyst in 2026

Data analytics used to be an “easy entry” career—learn SQL + a bit of Python/Excel and you could land a well-paid role. But in ...

8:43
How to Become a Data Analyst in 2026

442 views

21 hours ago

Learn Generative AI Tools for Corporate Success
NotbooklmAi #ai  #prompt #graphical #visuals #slidedec #Presentation #freeprompt

... with AI Integration: https://exly.live/aThW5a ◑ #Power BI & Data Visualization: https://exly.live/aThW5a ◑ #E-Learning Portal for ...

6:00
NotbooklmAi #ai #prompt #graphical #visuals #slidedec #Presentation #freeprompt

13 views

19 hours ago

Prinavin Govender
video1338647510
5:25
video1338647510

0 views

17 hours ago

DreamJobJourney
Excel Live Class in Hindi | Sorting, Advanced Filter, Fill Series, Paste Special | Reporting Tips-2

Master the art of professional reporting! Today at 8 PM, we are diving deep into the essential Excel tools that separate the pros ...

1:30:10
Excel Live Class in Hindi | Sorting, Advanced Filter, Fill Series, Paste Special | Reporting Tips-2

205 views

Streamed 1 day ago

Techstack
Power BI Full Course 2026 🔥 10 Hours Complete Training FREE | From Zero to Advanced | Techstack

If you want to master Power BI from scratch to advanced level, this 10 HOURS LONG FREE Power BI training on Techstack ...

9:01:42
Power BI Full Course 2026 🔥 10 Hours Complete Training FREE | From Zero to Advanced | Techstack

94 views

19 hours ago

Data Craft
Make Chart Dynamic by Using Scroll Bar | Use of Scroll Bar in Dashboard

Welcome to @datacraftofficial — your home for smart Excel, Python & Automation tricks! Power Query Part 6 How to Combine ...

20:15
Make Chart Dynamic by Using Scroll Bar | Use of Scroll Bar in Dashboard

56 views

9 hours ago